
0
Fund 1
Fund 2
Fund 3
Fund 4
Contact us
Contact Nuveen
Thank You
Thank you for your message. We will contact you shortly.
Listen to this insight
~ 15 minutes long
U.S. states face real headwinds — shifting federal policy, demographic change and climate risk among them. The data tell a reassuring story: state credit quality is at historic highs, backed by stronger balance sheets and deeper reserves. But meaningful differences across states make rigorous analysis essential.
Key takeaways
- State finances are the strongest in modern history, with near-record reserves, low debt burdens and improved pension funding across the board.
- States benefit from constitutional balanced-budget requirements, broad taxing authority and legal protections that meaningfully reduce default risk considerably for bondholders.
- Strong aggregate credit quality makes rigorous individual credit research more valuable, not less, due to meaningful differences in risk within rating categories.
Credit ratings reflect decades of fiscal discipline
The current financial position of U.S. states represents one of the strongest periods in modern history. More than 40 states carry credit ratings of AA or higher, reflecting resilient balance sheets and conservative fiscal management (Figure 1). This concentration of high-quality credits provides investors a deep pool of investment-grade opportunities — and makes informed credit analysis particularly valuable in identifying relative value.

State finances are at historic highs
Reserves are at near-record levels. According to the National Association of State Budget Officers’ (NASBO) Fiscal Survey of States, the median rainy day fund balance based on enacted 2026 budgets is projected to reach 14.4% of expenditures — nearly double the 7.9% median in 2019 and more than three times pre-Great Recession levels (Figure 2).
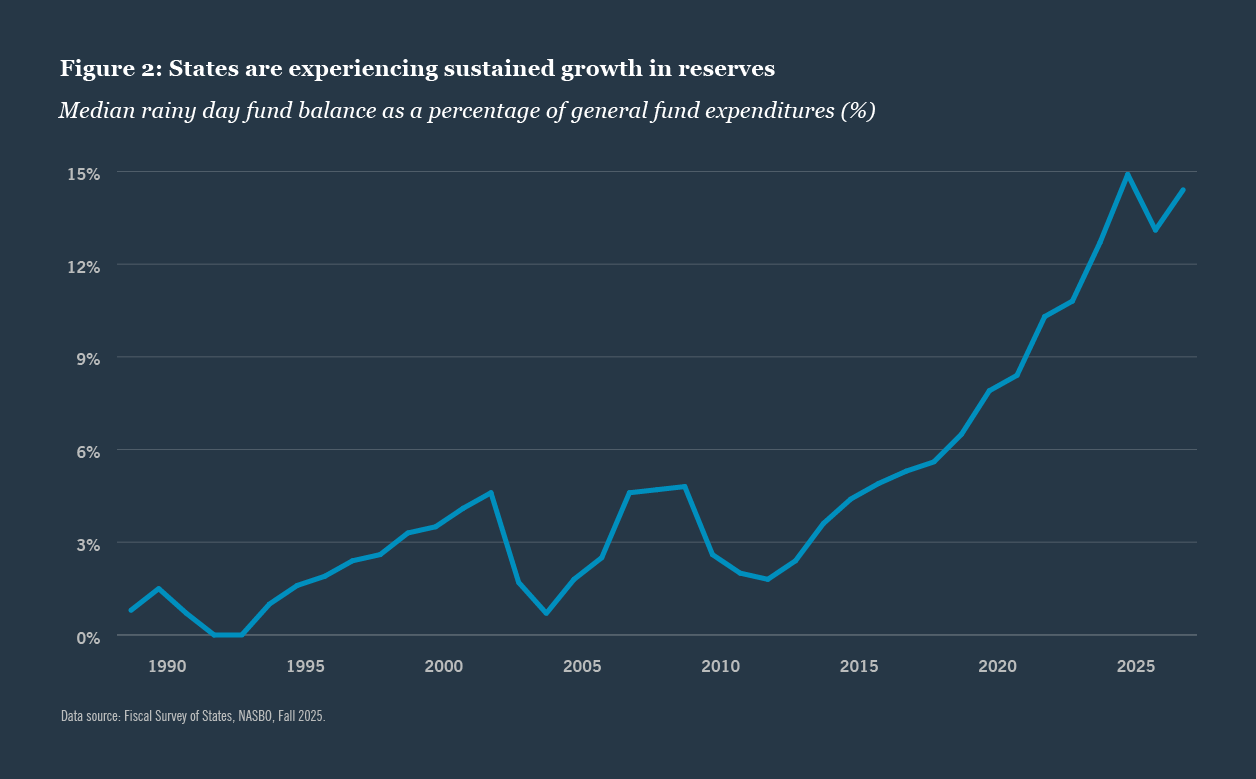
These reserves provide substantial cushion against economic downturns, revenue volatility and event risks, enabling states to maintain essential services and debt service payments even during challenging periods.
Tax revenues continue to grow. Led by steady income tax growth, overall state revenues rose 6.4% in 2025 compared to 2024.1
This growth continues a sustained long-term trend: state revenues have expanded significantly since 2019, interrupted only by a brief, shallow decline of approximately 1% in 2020 before rebounding sharply — rising more than 20% in 2021 alone. Growth has moderated from those post-pandemic peaks, reflecting normalization from stimulus-driven highs, but the underlying trend remains positive and supports ongoing fiscal stability.
Debt burdens have fallen sharply. According to Moody’s Ratings, combined state and local government debt stood at just 11.4% of GDP in 2024, down from 20.3% twenty-five years ago2 — a stark contrast to federal debt, which rose to 120.5% from 57.7% of GDP over the same period.3 This improvement reflects both reduced borrowing and robust economic growth, leaving states with considerable capacity to fund infrastructure and capital needs without threatening fiscal sustainability.
Pension funding has improved significantly. According to S&P Global Ratings, U.S. public pension funded ratios reached an average of 81% as of fiscal 2025 — an improvement of nearly 10 percentage points in just three years.4 Nevertheless, pension obligations remain a focal point of credit analysis.
States have the tools to remain fiscally sound
Balanced budget requirements impose discipline. Unlike the federal government, states cannot accumulate operating deficits indefinitely. Nearly every state operates under some form of balanced budget requirement, forcing fiscal adjustments through revenue or spending changes rather than deficit financing — a fundamental distinction from federal fiscal practice that provides essential credit support for bondholders.
States control both revenue and expenditures. States possess broad taxing and spending authority independent of the federal government, creating multiple levers for maintaining fiscal health even if federal funding patterns shift. On average, more than 80% of state general fund revenues are derived from state-controlled sources, including personal income taxes, corporate income taxes and sales taxes (Figure 3). On the spending side, states maintain discretion over a substantial portion of their budgets, enabling reductions when necessary to maintain balance. This two-sided flexibility differentiates state credits from many other sectors.
Governance quality has improved. Robust budgeting processes and multi-year forecasting enable proactive fiscal management, and about half of states now use a consensus revenue estimating process that reduces political influence and promotes realistic budgeting.

Michigan’s Consensus Revenue Estimating Conference, for example, convenes twice a year with the state treasurer, the directors of the Senate and House fiscal agencies and University of Michigan economists. The group approves a three-year revenue forecast in January that serves as the starting point for the governor’s budget, then revises it in May.
The consensus estimate is binding — it defines the scope of available resources and limits the potential for budget deficits. Governance practices like this contribute to more stable fiscal outcomes and reduce the likelihood of budget crises.
The legal framework is built to protect bondholders
States cannot declare bankruptcy. Unlike municipalities, states are protected by constitutional principles of state sovereignty that prevent federal judicial oversight of their fiscal affairs — meaning states must address fiscal challenges through their own political and budgetary processes.
No state is remotely close to the kind of financial distress that would prompt such a discussion; strong fiscal positions make bankruptcy not just legally unavailable but practically unnecessary.
General obligation bonds carry the strongest protections. Most states provide constitutional or statutory appropriation of debt service for GO bonds, placing debt payments ahead of most other expenditures. Article VII of the New York State Constitution, for example, mandates that if the legislature fails to appropriate funds for state debts, the comptroller must do so from first available general fund revenues — effectively creating a first lien on tax revenues. This legal framework provides bondholders with strong protection and significantly reduces the risk of non-payment under fiscal stress.
Appropriation-backed debt has structural safeguards. While these bonds do not carry the same constitutional pledge as GO bonds, payment schedules are typically structured to avoid late-budget adoption issues, and many bond structures feature advance trustee set-asides that transfer debt service funds to trustees ahead of payment dates.
These legal and structural protections establish a strong foundation of bondholder security that distinguishes municipal debt from other fixed income sectors. The nuances of different pledge structures and legal frameworks remain a critical area for analysis.
Credit research matters more, not less, in a high-quality market
Aggregate strength masks meaningful differences. Individual state circumstances vary in important ways — in economic concentration, unfunded pension liabilities, demographic trends and governance quality — as do the specific security structures and legal protections of individual bond issuances.
Rating categories compress a wide range of underlying fiscal conditions, and the difference between a AAA rated state and a AA rated one — or between two AA rated states with very different pension burdens or revenue structures — can be material to how bonds are priced. Rigorous fundamental analysis helps delineate distinctions that ratings alone cannot capture.
Revenue concentration creates differentiated risk profiles, despite similar ratings. A state that relies heavily on personal income taxes from a high-earning taxpayer base faces different risks than one that relies on sales taxes or one with revenues heavily concentrated in a single industry. Risk profiles can differ materially even among states carrying the same rating, and understanding how each profile may respond to stress requires going beyond the public credit rating.
Slow-moving trends compound over time. Economic, demographic and climate-related trends also vary significantly by state and carry long-term implications for revenue growth and expenditure demands. States experiencing population growth and economic diversification are better positioned to grow through fiscal challenges than those facing outmigration, aging populations or narrow economic bases.
States with significant exposure to physical climate risks — hurricanes, flooding, wildfires or drought — or whose economies are heavily concentrated in carbon-intensive industries face distinct long-term fiscal pressures that may not be fully reflected in near-term credit metrics. These trends develop slowly but compound over time and can crystallize quickly during acute events, making them important inputs to analyze even when near-term metrics look strong.
Stress widens the gap between stronger and weaker credits. During acute stress — whether driven by economic deterioration, financial market disruption or climate-related events — issuers with stronger fundamentals and better liquidity generally recover more quickly. Credit selection matters in normal markets but matters considerably more when conditions deteriorate unexpectedly.
The municipal market has proven its resilience
The market has weathered repeated periods of volatility. During the Great Recession, the 2013 Taper Tantrum and the onset of Covid-19, the market initially experienced significant price fluctuations and temporary liquidity constraints — but stabilized quickly each time. At the peak of pandemic-related stress, benchmark yields surged more than 2.00% over two weeks in March 2020, only to fully recover within four days and continue declining through August 2020 as the market better understood government action to stabilize market liquidity.5
This pattern of rapid recovery reflects enduring confidence in the fundamental credit quality of municipal bonds — though it also underscores the importance of credit selection, as issuers with the strongest fundamentals are best positioned to maintain liquidity and recover most effectively under stress.
Credit selection always matters, but it matters considerably more when conditions deteriorate unexpectedly.
Investor demand remains robust. 2025 marked the fourth consecutive year of record trade count,6 and new bond issuances are typically oversubscribed, giving states reliable access to capital markets and enabling them to maintain capital programs and refinance debt efficiently.
No state has defaulted since the Great Depression. Historical default rates for state debt are extraordinarily low compared to corporate bonds or other fixed income asset classes — a track record that speaks to the enduring strength of the structural and legal protections underpinning state credit.
Strong states still require careful research
State credit quality is strong, and the municipal market has proven its resilience, but neither fact eliminates the need for individualized analysis. Meaningful differences across states in fiscal flexibility, revenue diversity, pension obligations, governance quality and climate-related fiscal risk become more pronounced during periods of volatility, affecting investment outcomes.
Understanding those differences — alongside the specific security structures and legal frameworks of individual bond issuances — creates opportunities to identify relative value and optimize risk-adjusted returns across market cycles.
For institutional investors seeking tax-advantaged income and capital preservation, state municipal bonds may represent a cornerstone holding. Realizing that potential, however, requires rigorous credit research, careful issuer selection and continuous monitoring of fiscal, economic and political developments.
Endnotes
1 U.S. Census state and local tax revenue collection data. Quarterly Summary of State & Local Tax Revenue Data Tables.
2 State and local governments face higher debt, less free cash flow amid capex catchup | Sector In-Depth | Moody’s.
3 Federal Debt: Total Public Debt as Percent of Gross Domestic Product (GFDEGDQ188S) | FRED | St. Louis Fed.
4 https://www.capitaliq.spglobal.com/apisv3/spg-webplatform-core/ratingsdirect/ creditresearch?rid=3508235
5 Data source: MSRB, 2020 Municipal Bond Market in Review, January 2021.
6 Data source: MSRB, 2025 Municipal Market Year in Review: An Extraordinary Year, January 2026.
Sources
U.S. State Ratings And Outlooks: Current List
NASBO_Fall_2025_Fiscal_Survey_Full_Report_S.pdf
Fiscal 50: State Trends and Analysis | The Pew Charitable Trusts
Quarterly Summary of State & Local Tax Revenue Data Tables
State and local governments face higher debt, less free cash flow amid capex catchup | Sector In-Depth | Moody’s
Federal Debt: Total Public Debt as Percent of Gross Domestic Product (GFDEGDQ188S) | FRED | St. Louis Fed
https://www.capitaliq.spglobal.com/apisv3/spg-webplatform-core/ratingsdirect/ creditresearch?rid=3508235
https://budgetblog.nasbo.org/blogs/john-hicks/2019/11/18/revenue-estimates-a-critical-step-in-the-budget-pr
https://www.msrb.org/sites/default/files/MSRB-2020-Municipal-Bond-Market-in-Review.pdf
https://www.msrb.org/sites/default/files/2026-01/MSRB-2025-Municipal-Market-Year-in-Review.pdf
This material is not intended to be a recommendation or investment advice, does not constitute a solicitation to buy, sell or hold a security or an investment strategy, and is not provided in a fiduciary capacity. The information provided does not take into account the specific objectives or circumstances of any particular investor, or suggest any specific course of action. Investment decisions should be made based on an investor’s objectives and circumstances and in consultation with his or her financial professionals.
The views and opinions expressed are for informational and educational purposes only as of the date of production/writing and may change without notice at any time based on numerous factors, such as market or other conditions, legal and regulatory developments, additional risks and uncertainties and may not come to pass. This material may contain “forward-looking” information that is not purely historical in nature. Such information may include, among other things, projections, forecasts, estimates of market returns, and proposed or expected portfolio composition. Any changes to assumptions that may have been made in preparing this material could have a material impact on the information presented herein by way of example. Performance data shown represents past performance and does not predict or guarantee future results. Investing involves risk; principal loss is possible.
All information has been obtained from sources believed to be reliable, but its accuracy is not guaranteed. There is no representation or warranty as to the current accuracy, reliability or completeness of, nor liability for, decisions based on such information and it should not be relied on as such. For term definitions and index descriptions, please access the glossary on nuveen.com. Please note, it is not possible to invest directly in an index.
Important information on risk
Investing involves risk; principal loss is possible. All investments carry a certain degree of risk and there is no assurance that an investment will provide positive performance over any period of time. Investing in municipal bonds involves risks such as interest rate risk, credit risk and market risk. The value of the portfolio will fluctuate based on the value of the underlying securities. There are special risks associated with investments in high yield bonds, hedging activities and the potential use of leverage. Portfolios that include lower rated municipal bonds, commonly referred to as “high yield” or “junk” bonds, which are considered to be speculative, the credit and investment risk is heightened for the portfolio. Bond insurance guarantees only the payment of principal and interest on the bond when due, and not the value of the bonds themselves, which will fluctuate with the bond market and the financial success of the issuer and the insurer. No representation is made as to an insurer’s ability to meet their commitments. This information should not replace an investor’s consultation with a financial professional regarding their tax situation. Nuveen is not a tax advisor. Investors should contact a tax professional regarding the appropriateness of tax-exempt investments in their portfolio. If sold prior to maturity, municipal securities are subject to gain/losses based on the level of interest rates, market conditions and the credit quality of the issuer. Income may be subject to the alternative minimum tax (AMT) and/or state and local taxes, based on the state of residence. Income from municipal bonds held by a portfolio could be declared taxable because of unfavorable changes in tax laws, adverse interpretations by the Internal Revenue Service or state tax authorities, or noncompliant conduct of a bond issuer. It is important to review your investment objectives, risk tolerance and liquidity needs before choosing an investment style or manager.
Nuveen, LLC provides investment solutions through its investment specialists.
This information does not constitute investment research as defined under MiFID.
Please be advised, this content is restricted to financial professional access only.
Login or register as a financial professional to gain access to this information.
or
Not registered yet? Register
You are about to access our website for visitors outside of the United States.
You're about to access test site
You are about to access our website for Nuveen Global Cities REIT
You are leaving the Nuveen website.
You are leaving the Nuveen website and going to the website of the MI 529 Advisor Plan, distributed by Nuveen Securities, LLC.The Nuveen website for institutional investors is available for you.
You are about to access our website for visitors outside of the United States.
You are about to access our website for Nuveen Churchill Private Capital Income Fund (“NC - PCAP”)
