

Listen to this insight
~ 14 minutes long
Himani Trivedi, head of structured credit at Nuveen, and Tracey Jackson, CLO client portfolio manager, explore how AI-driven disruption and Middle East geopolitical uncertainty are creating targeted spread widening — and potential opportunities across CLO BB debt and CLO equity — for investors positioned to act.
Understanding the sources of loan market volatility
AI fears and disruption
The software sector has entered a period of sharp volatility as the market transitions from asking "who wins from AI" to understanding "who will be disrupted." The catalyst for heightened market uncertainty came in January with the launch of Claude’s advanced coding capabilities. What unsettled investors was not just the technology itself, but the unprecedented pace of advancement.
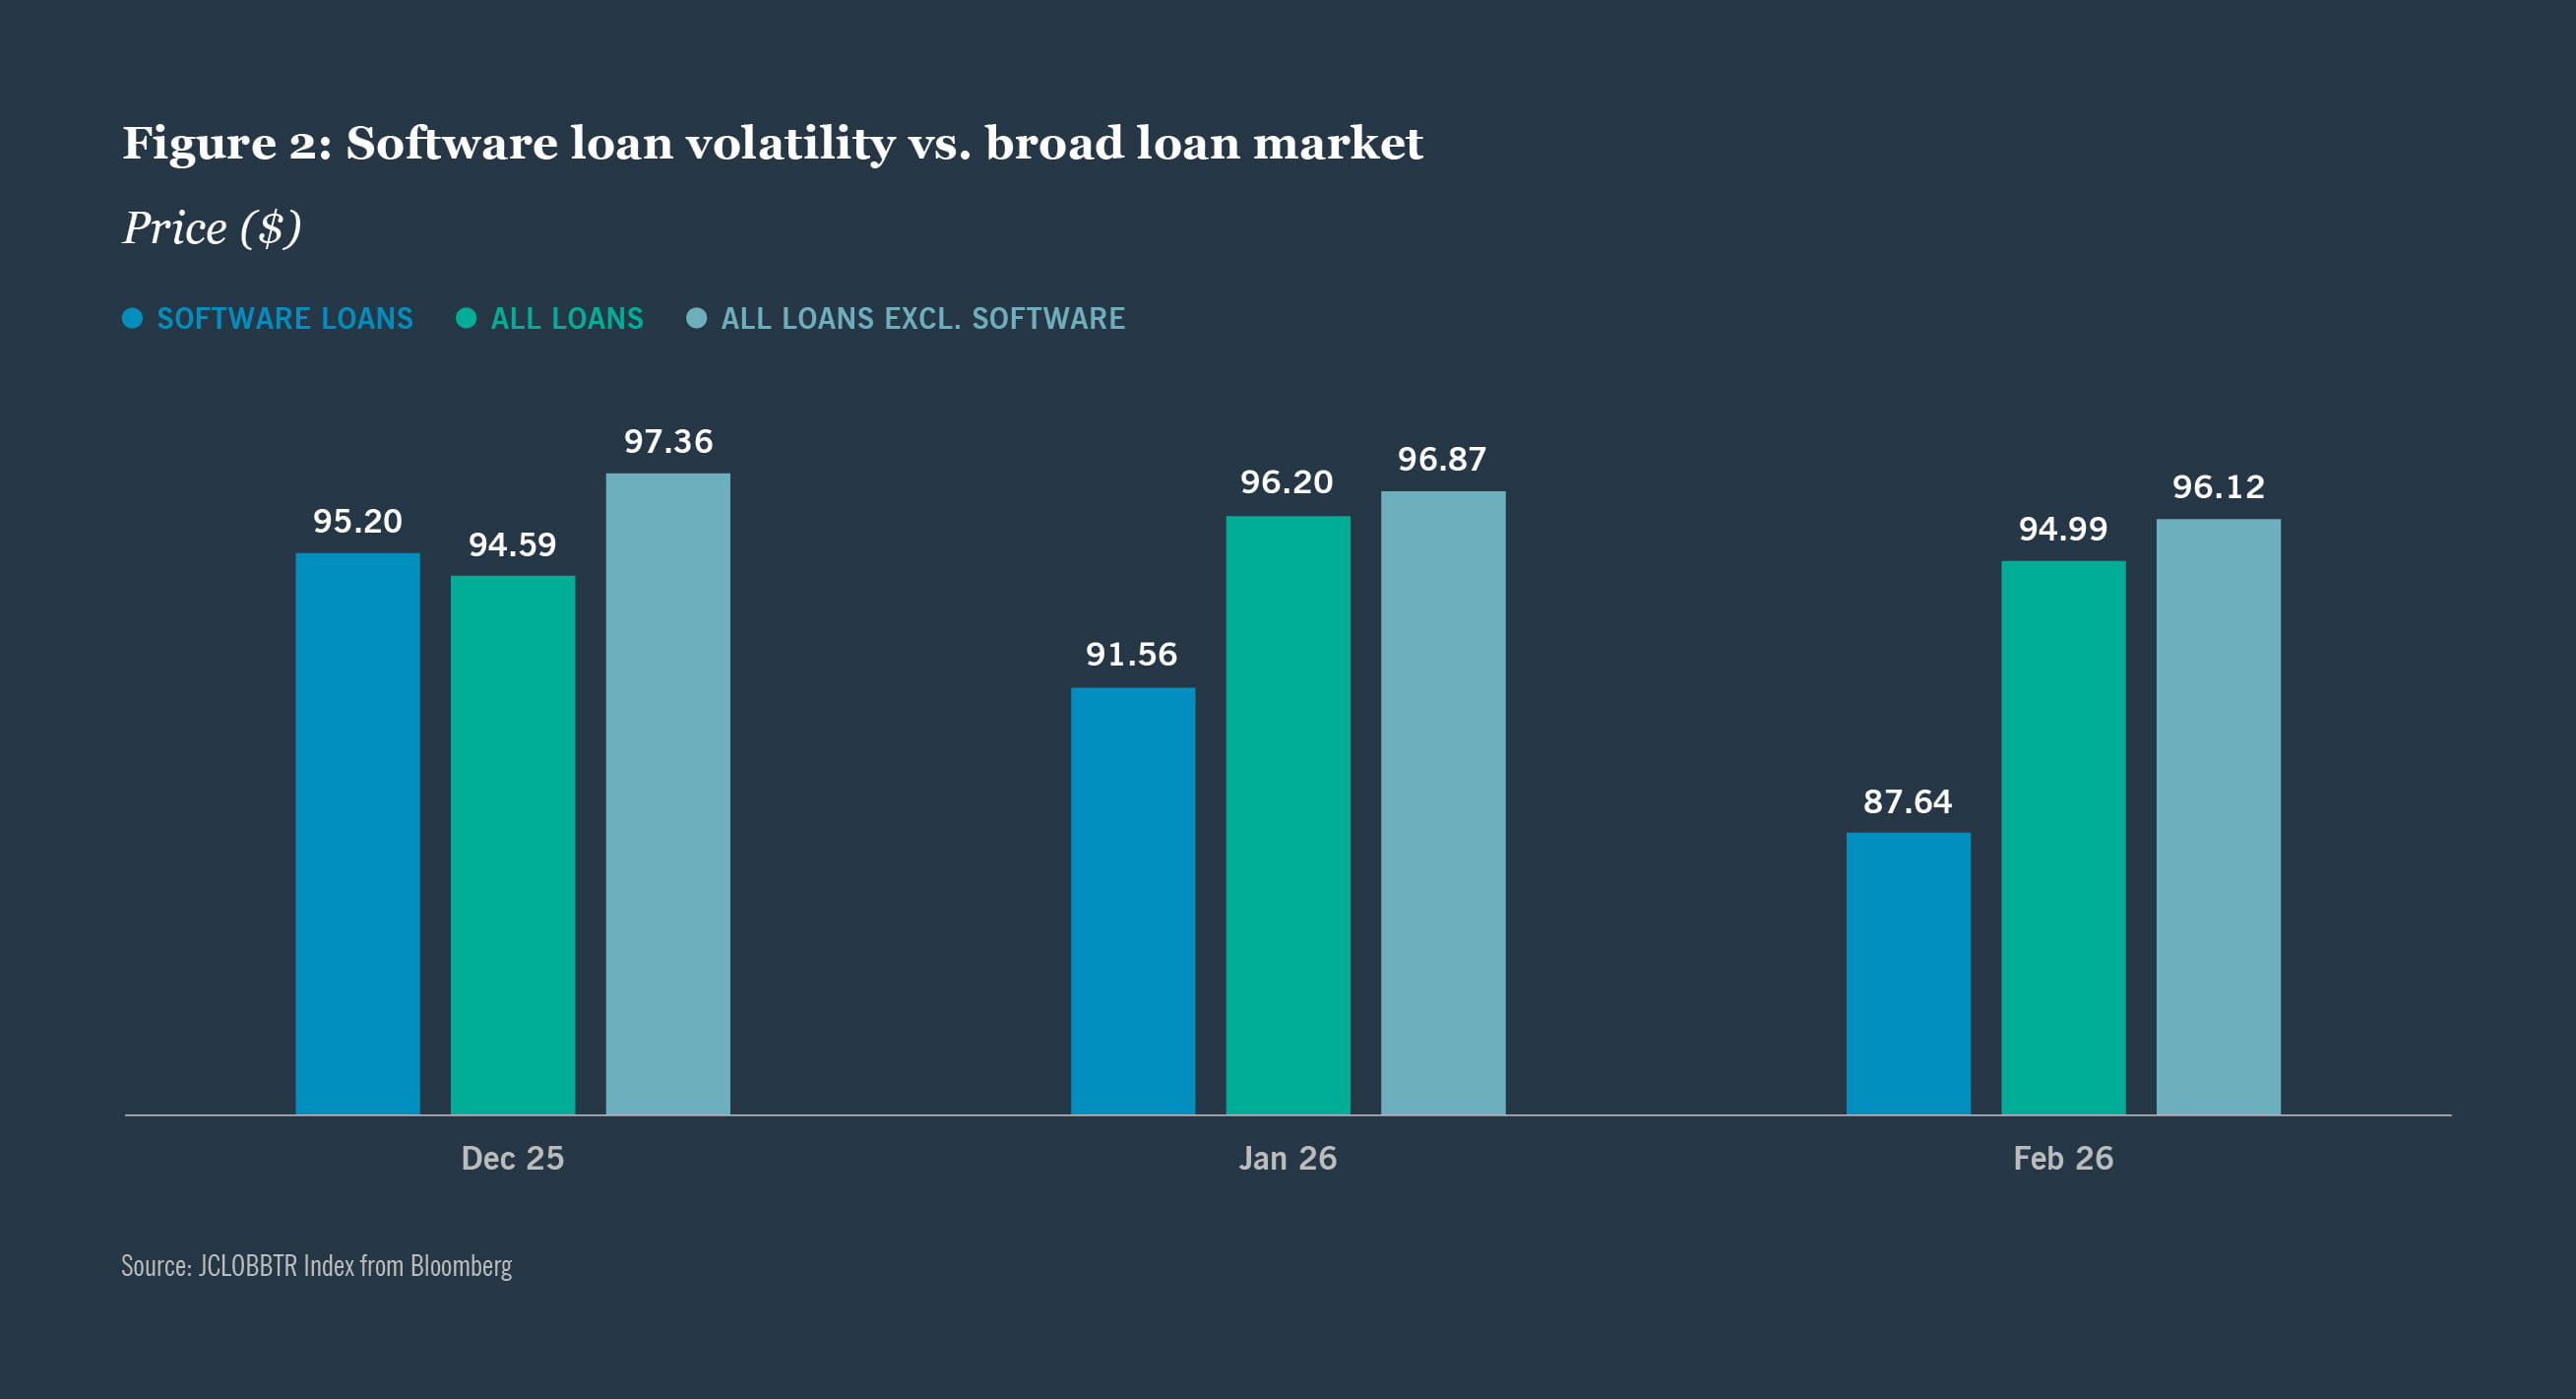
From a leveraged finance perspective, the software sector has undergone a warranted but somewhat indiscriminate repricing. Based on market observations, software valuations have declined from approximately 10x revenue a year ago to around 3.5-4x revenue today. In the Morningstar LSTA Leveraged Loan Index, software spreads have widened this year by more than 200 basis points, while trading levels have fallen from the high-90s to the low-90s or high-80s.
This environment creates both challenges and opportunities for credit investors. Not all software companies are equally exposed to AI risks, such as subsectors cybersecurity and infrastructure.
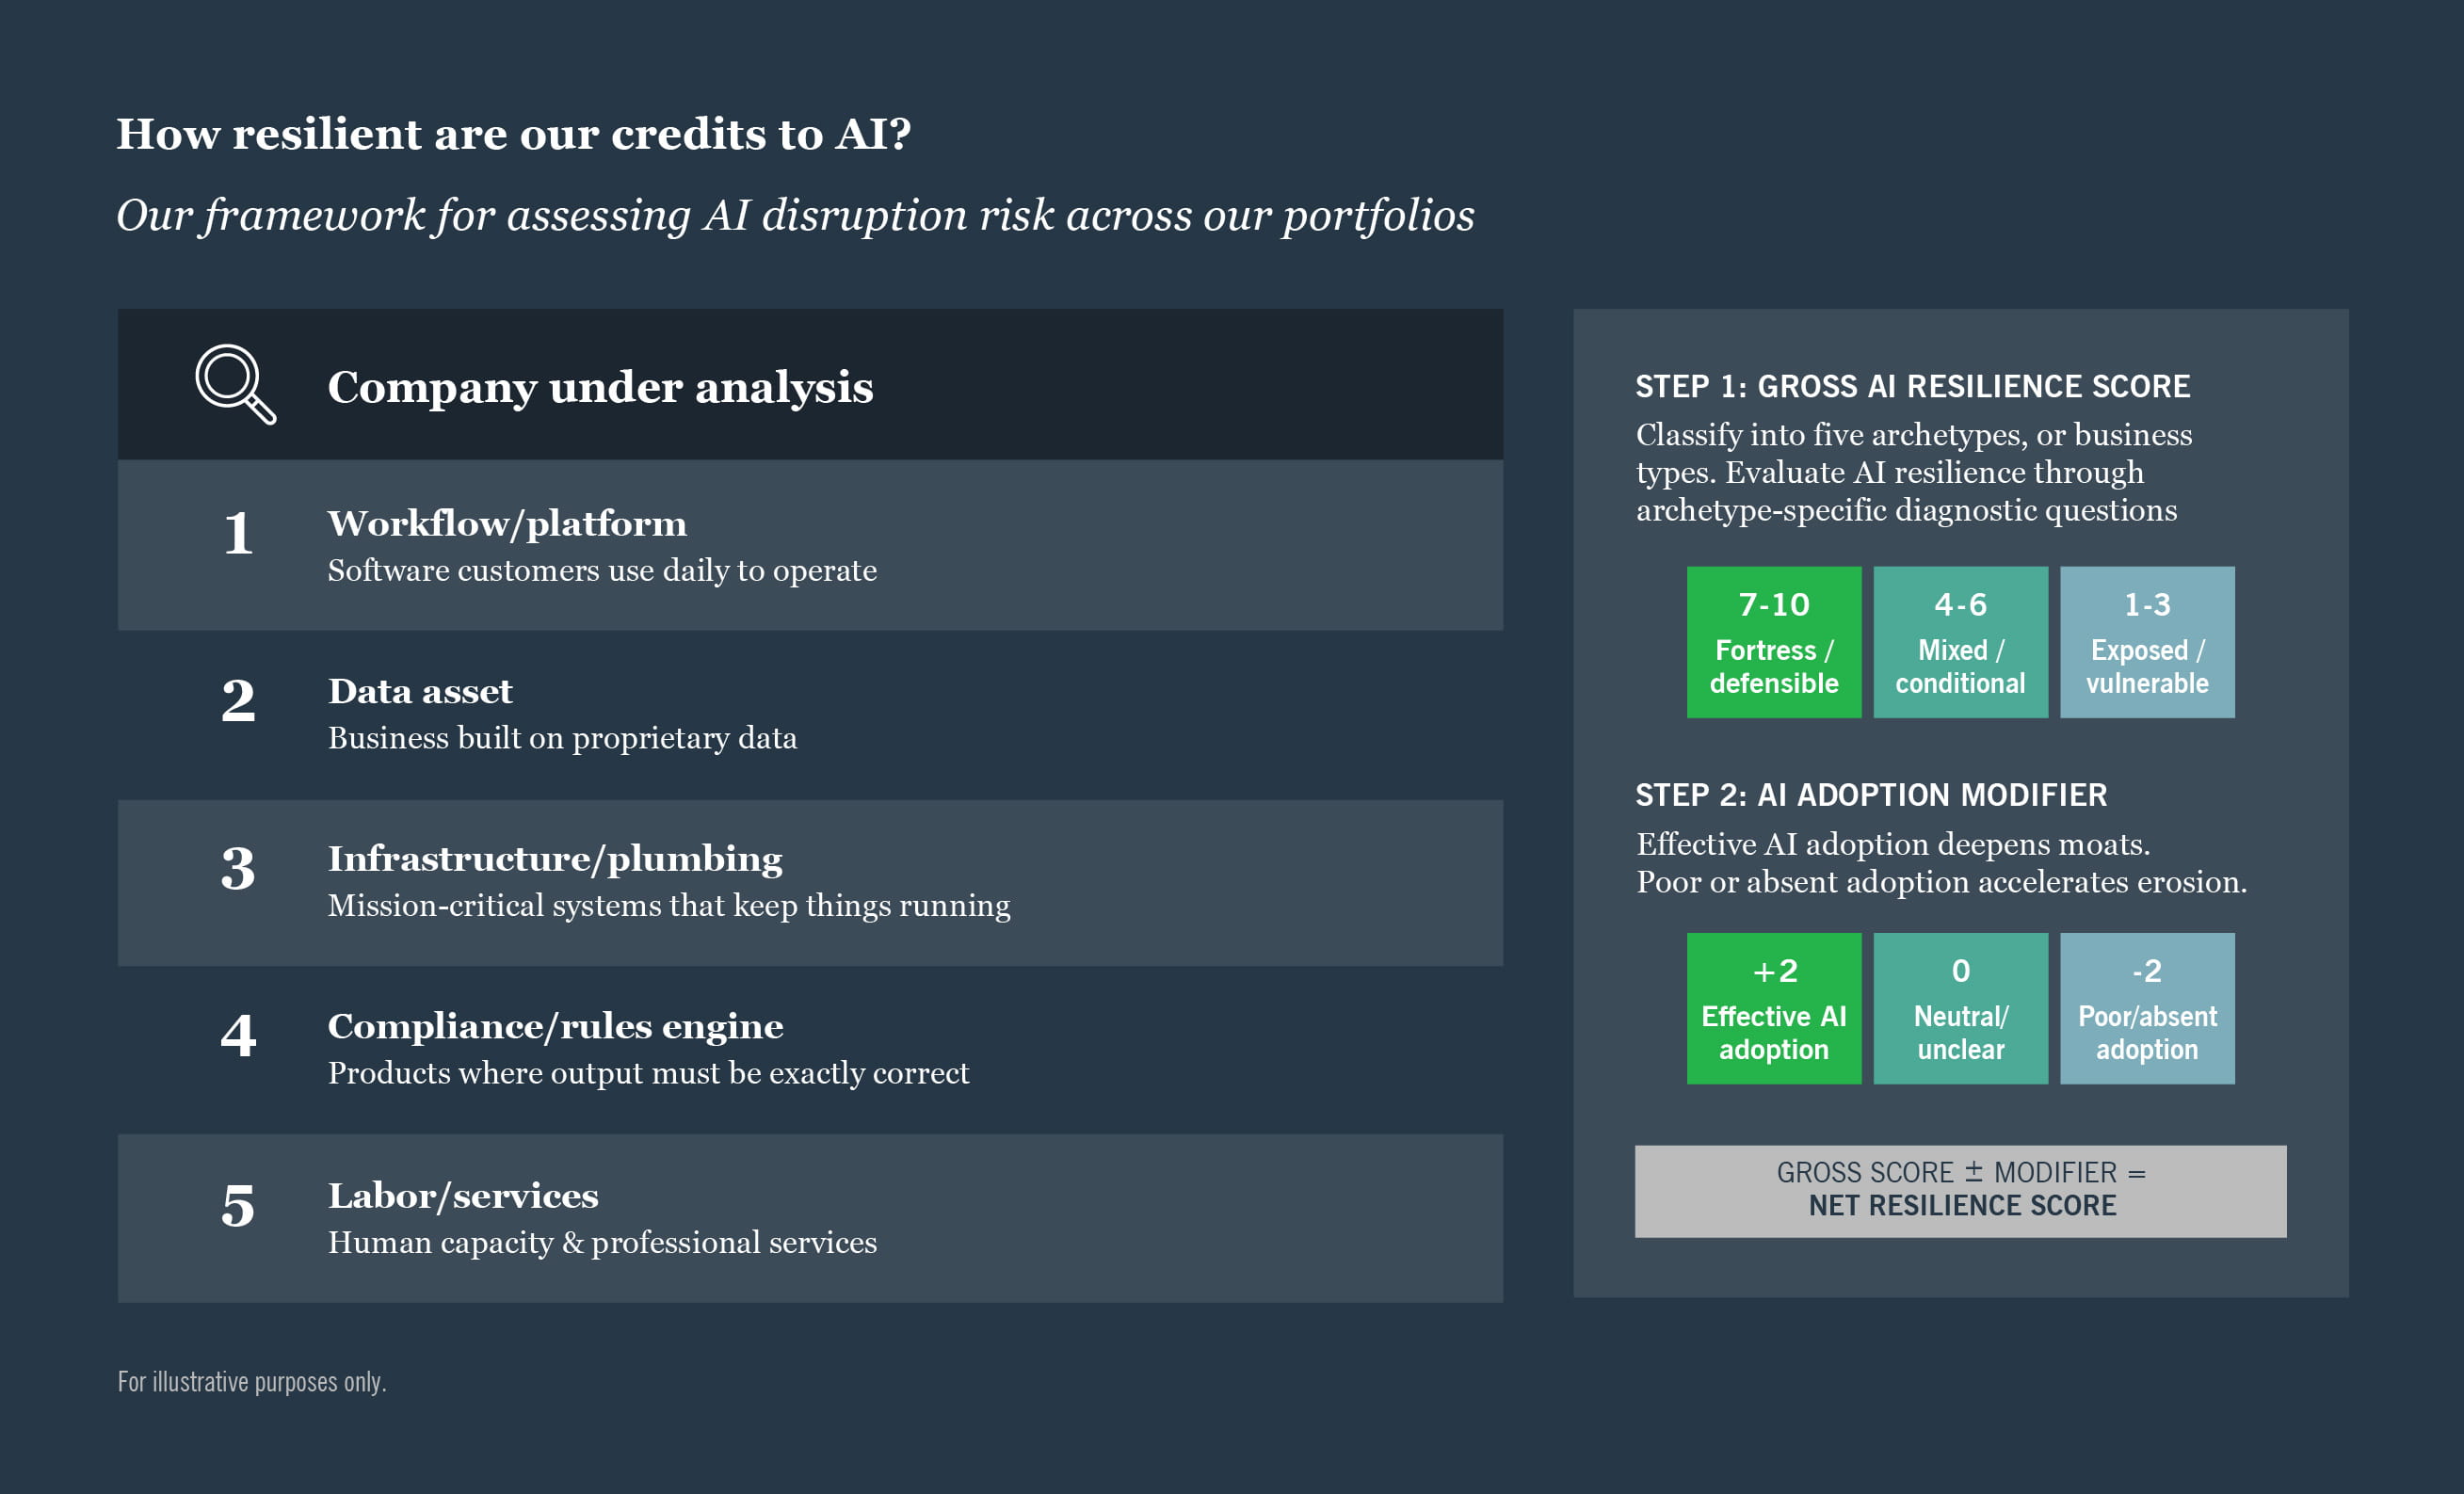
Our investment process focuses on identifying companies with resilient cash flows and strong debt-service capacity, allowing us to distinguish between businesses that may face disruption and those that are well positioned to benefit from AI-driven change. This differentiation can create attractive entry points in sectors where market repricing has been broad rather than selective.
While the market and managers are still evaluating the continued risks and challenges to the software sector, we believe AI will ultimately be beneficial in the long term, with the potential to improve productivity and support economic growth.

Ongoing situation in Iran
Elevated oil volatility has been driven by uncertainty around shipping safety, insurance, and routing behavior tied to the Iran conflict. We are closely monitoring the status of the Strait of Hormuz, the single most important maritime chokepoint in the global energy system. Asian markets are overwhelmingly exposed to this disruption, but Europe is also exposed through refined products such as jet fuel. While we do not yet know how long the volatility will persist, the market will certainly look through volatility if duration is a matter of weeks versus months.
As we evaluate the impact on the market, we break it into direct and indirect impact, with direct being higher energy costs and potential trade flow disruption.
The most directly impacted sectors:
- Energy — issuers may experience a short-term tailwind due to higher commodity prices, but energy investors (especially credit) have historically looked through short-term swings in prices.
- Chemicals — may have a short term benefit; higher oil and logistics disruptions impact both global cost curves and trade flows.
- Transportation — monitoring potential for disruption of consumer travel; higher jet fuel costs - should have a minimal impact to airlines since they are generally well hedged and historically been successful at passing through fuel costs.
- Retail — supply chain impact, freight costs, and potential fallout from higher energy prices on discretionary spending.
Current state of the U.S. leveraged loan market
Targeted loan volatility
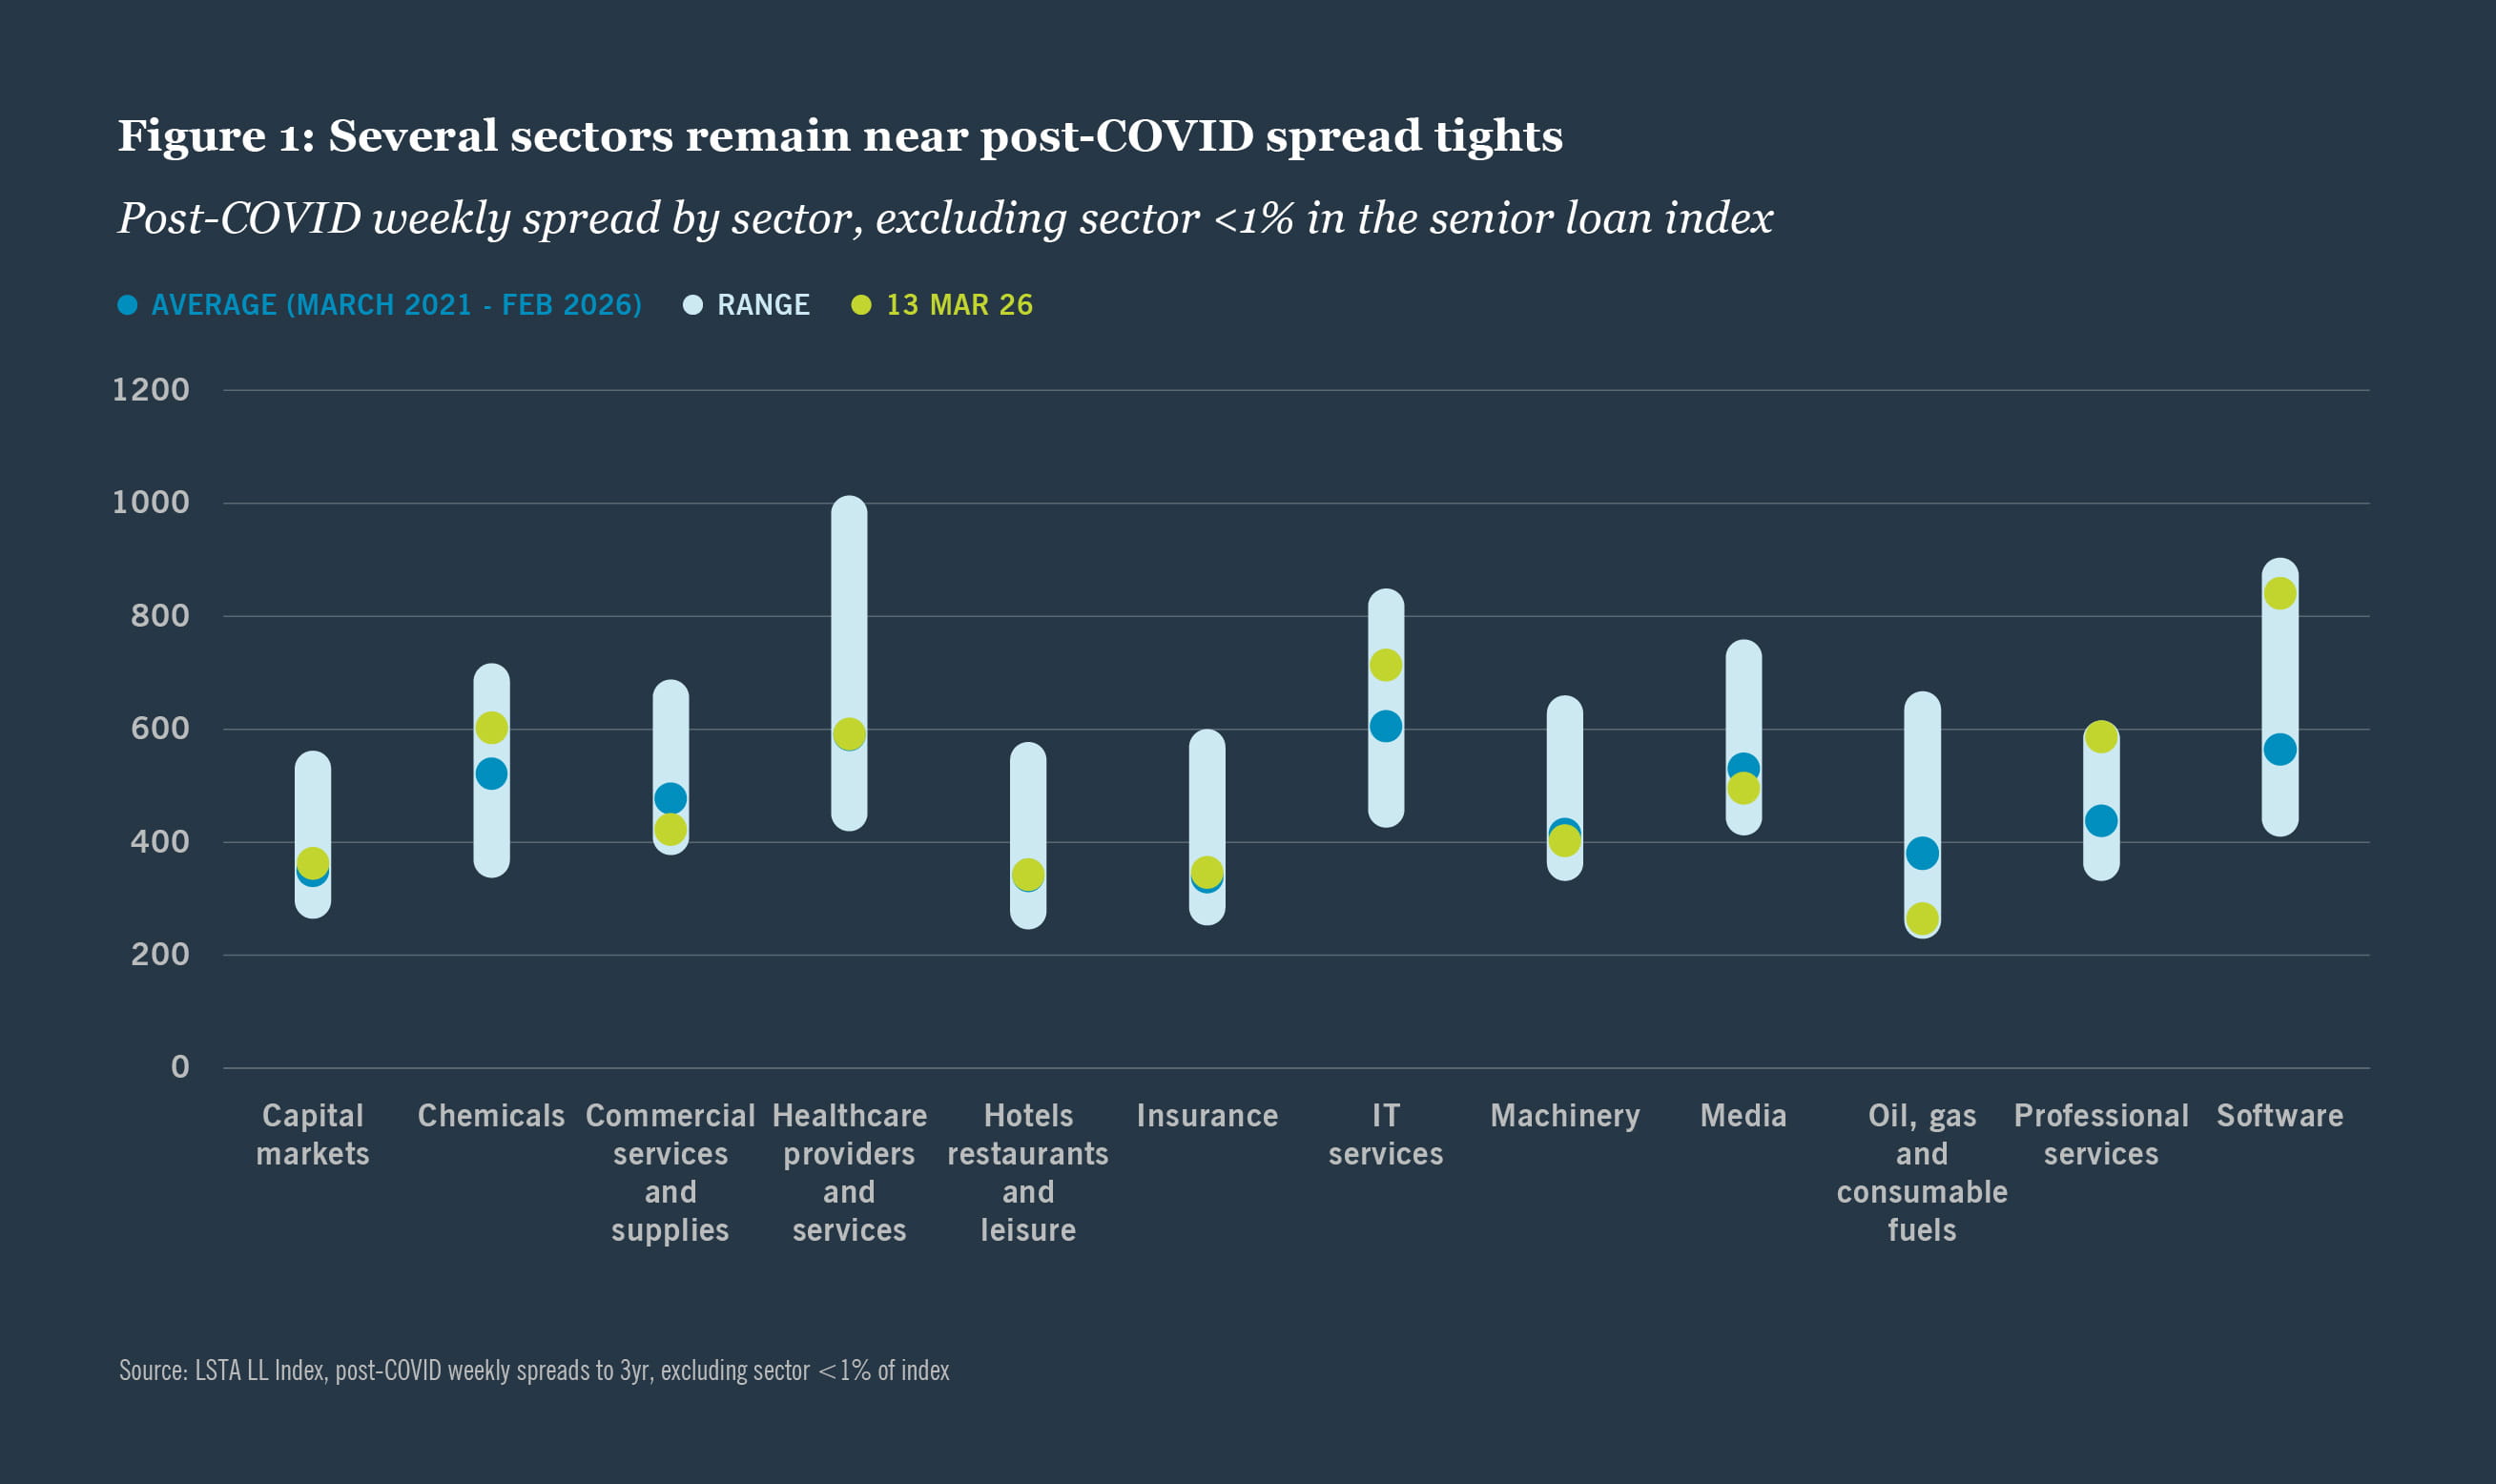
Looking at the YTD loan index price movement, the surface level would suggest an opportunity to buy loans nearly 2 points lower than where loans ended 2025. However, drilling into the volatility below in Figure 1, we see the spread widening has been targeted to those sectors impacted by AI fears and Iran with the largest widening coming from Building Products, Chemicals, IT Services, and Software. Several other sectors are either 1) near post-COVID spread tights or 2) still tighter than the post-COVID average. Some CLO managers have reduced allocations to the volatile sectors and rotated into those that are less affected, this has provided additional pricing support and further spread dispersion by sector, since CLO managers are reluctant to hold large cash allocations.
Opportunity in volatility for CLO investing
CLO BB debt
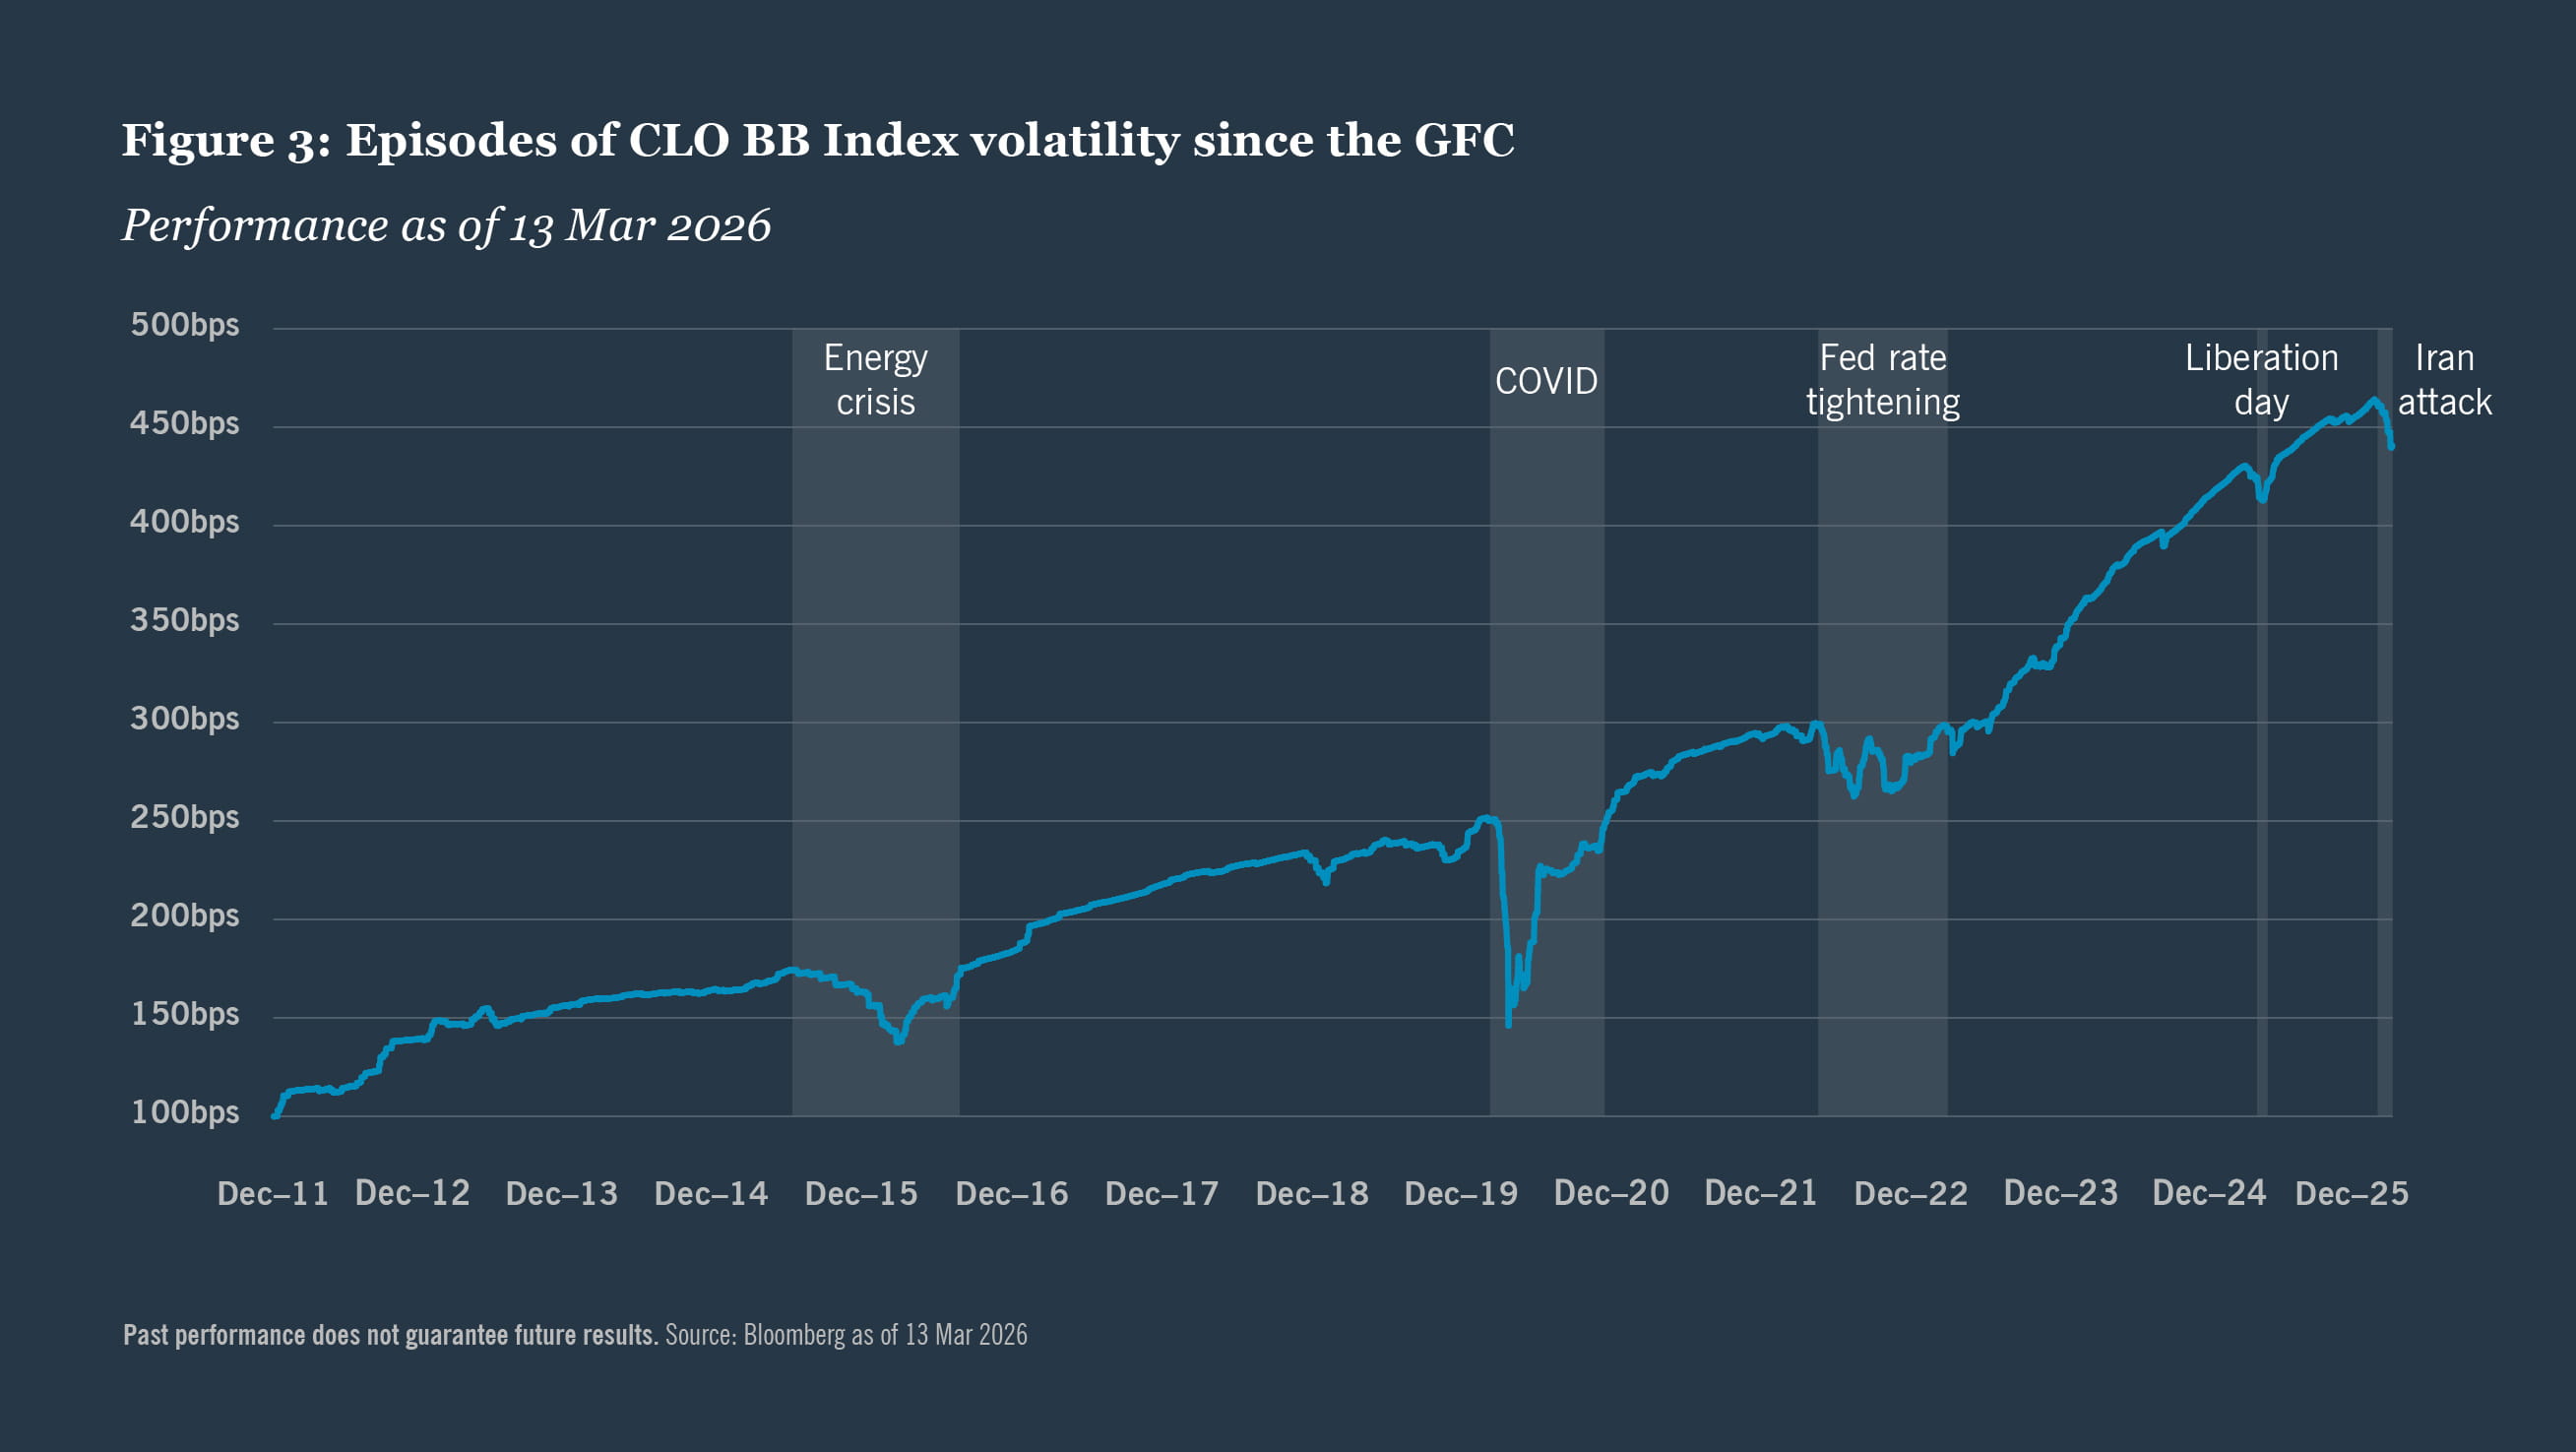
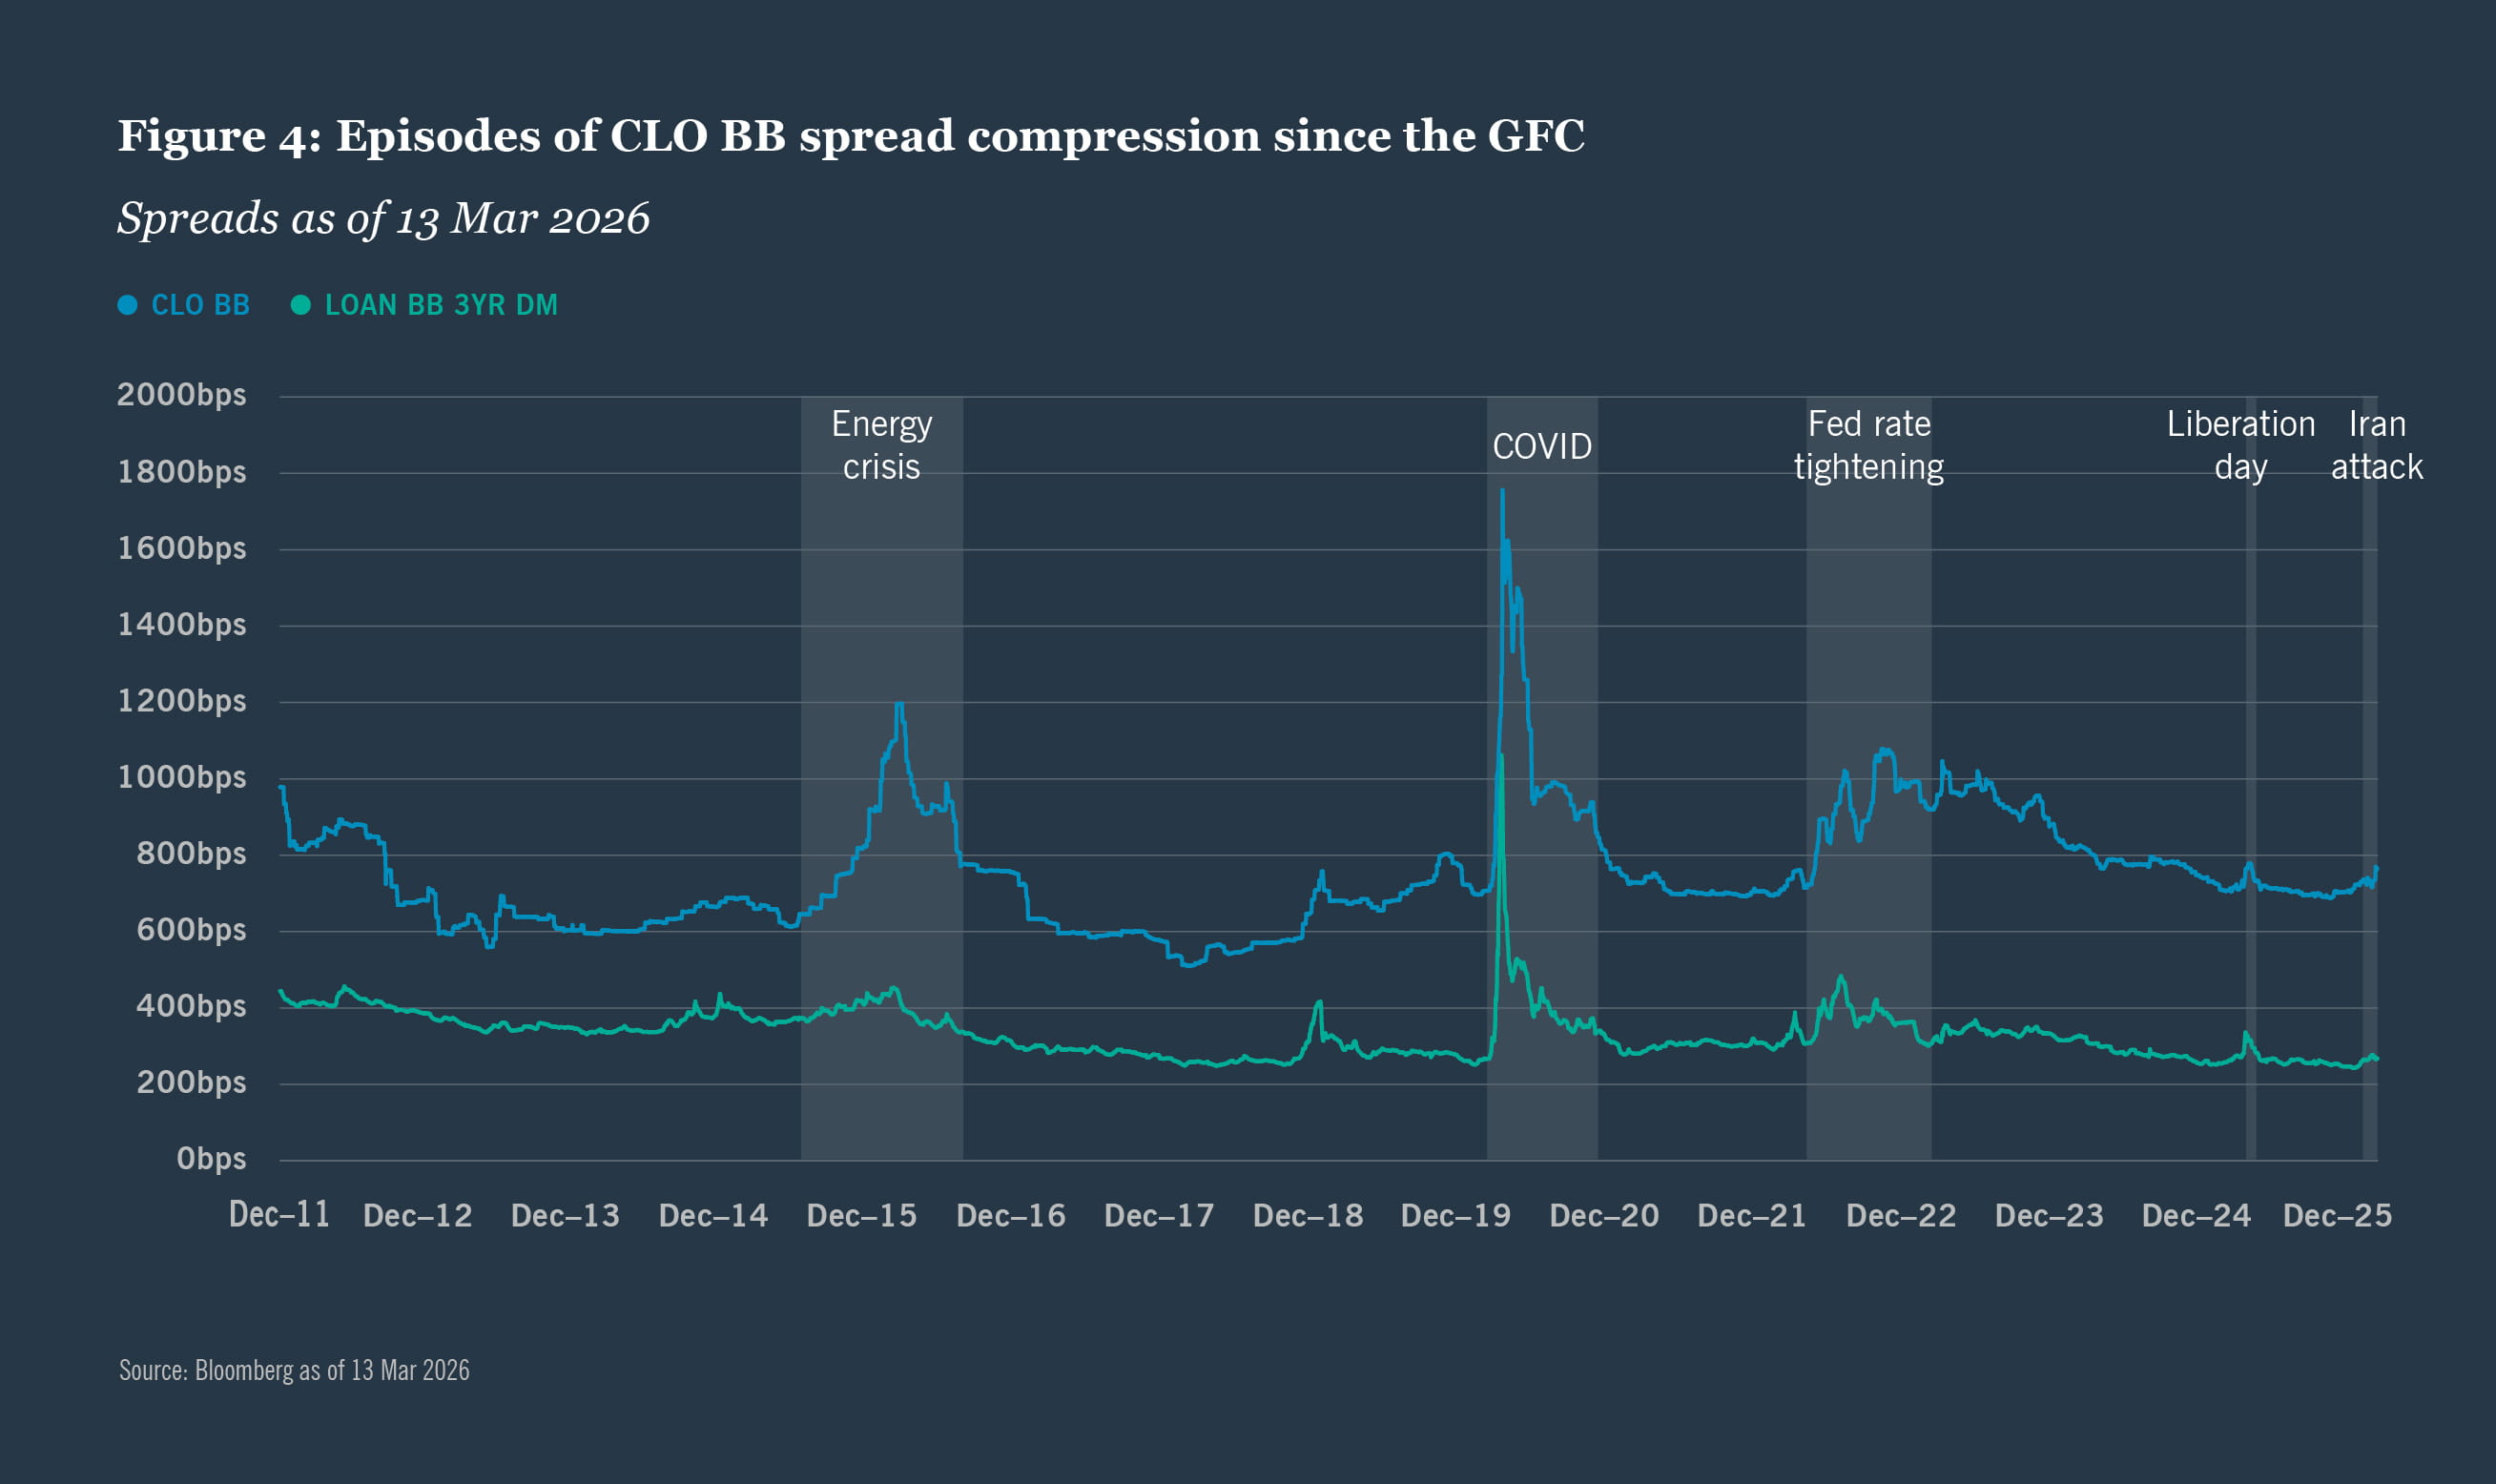
Looking back on the episodes of volatility since the Great Financial Crisis (“GFC”), there is an evolution to the volatility reaction. Looking at the energy crisis and COVID, compared to the ultimate impairment rate (which we note in Figure 5b later), the mark-to-market volatility for CLO BBs tended to significantly overshoot fundamental credit losses. While price risk remains for this asset class, historically patient, buy-and-hold investors were generally rewarded relative to those forced to sell at depressed values. As institutional and private wealth investors noted this resilience, the CLO BB volatility of macro-economic events, such as rate tightening, Liberation Day, and now Iran, have seen a muted drawdown comparatively.
Complementary investment in BB-rated asset classes
Looking at CLO BB debt vs loan and high yield returns, all three instruments carry below investment grade credit ratings but have different structural characteristics, cash flow profiles, and risk-return dynamics.
The spread differential between CLO BBs and the other two asset classes — often 250 to 500 basis points wider — is frequently referred to as the complexity or structural premium, and capturing this premium is a central thesis for CLO BB investing. See Figure 4 below.
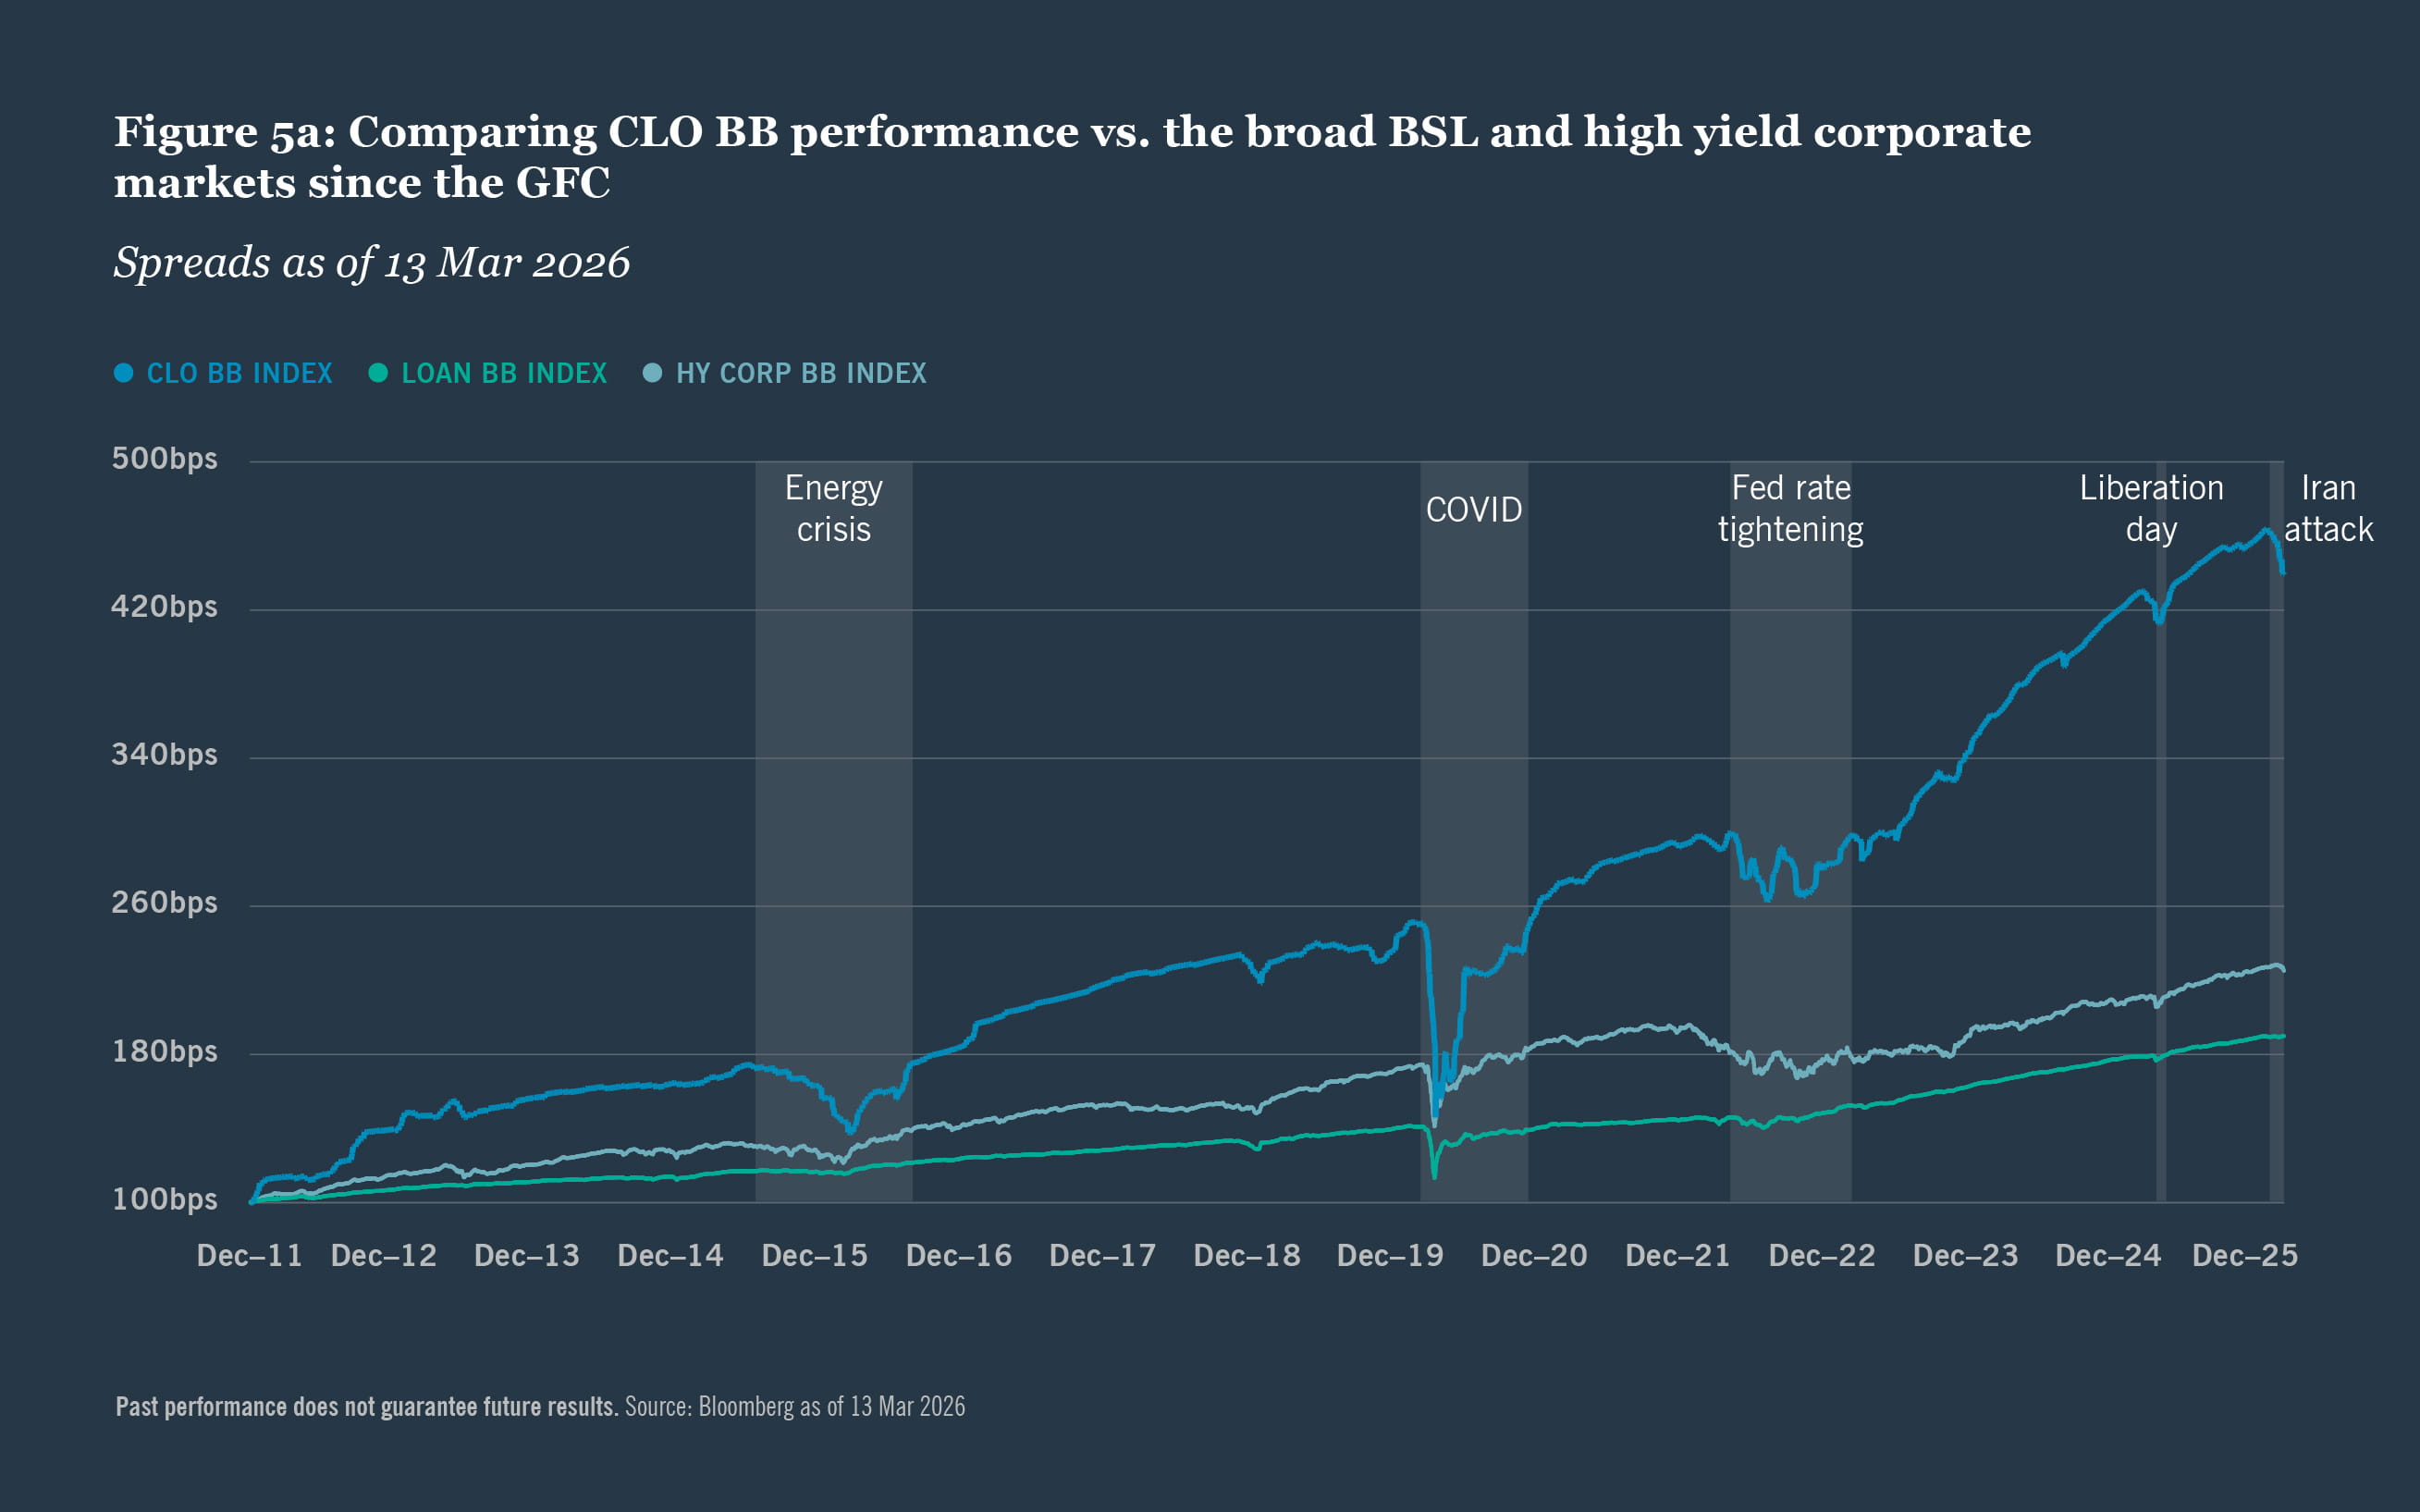
CLO BB tranches exhibit larger mark-to-market drawdowns than similarly rated leveraged loans or high yield bonds during acute stress but have historically recovered well for buy-and-hold investors, suggesting the excess spread they offer is in part compensation for this mark-to-market risk. See Figure 5a below.
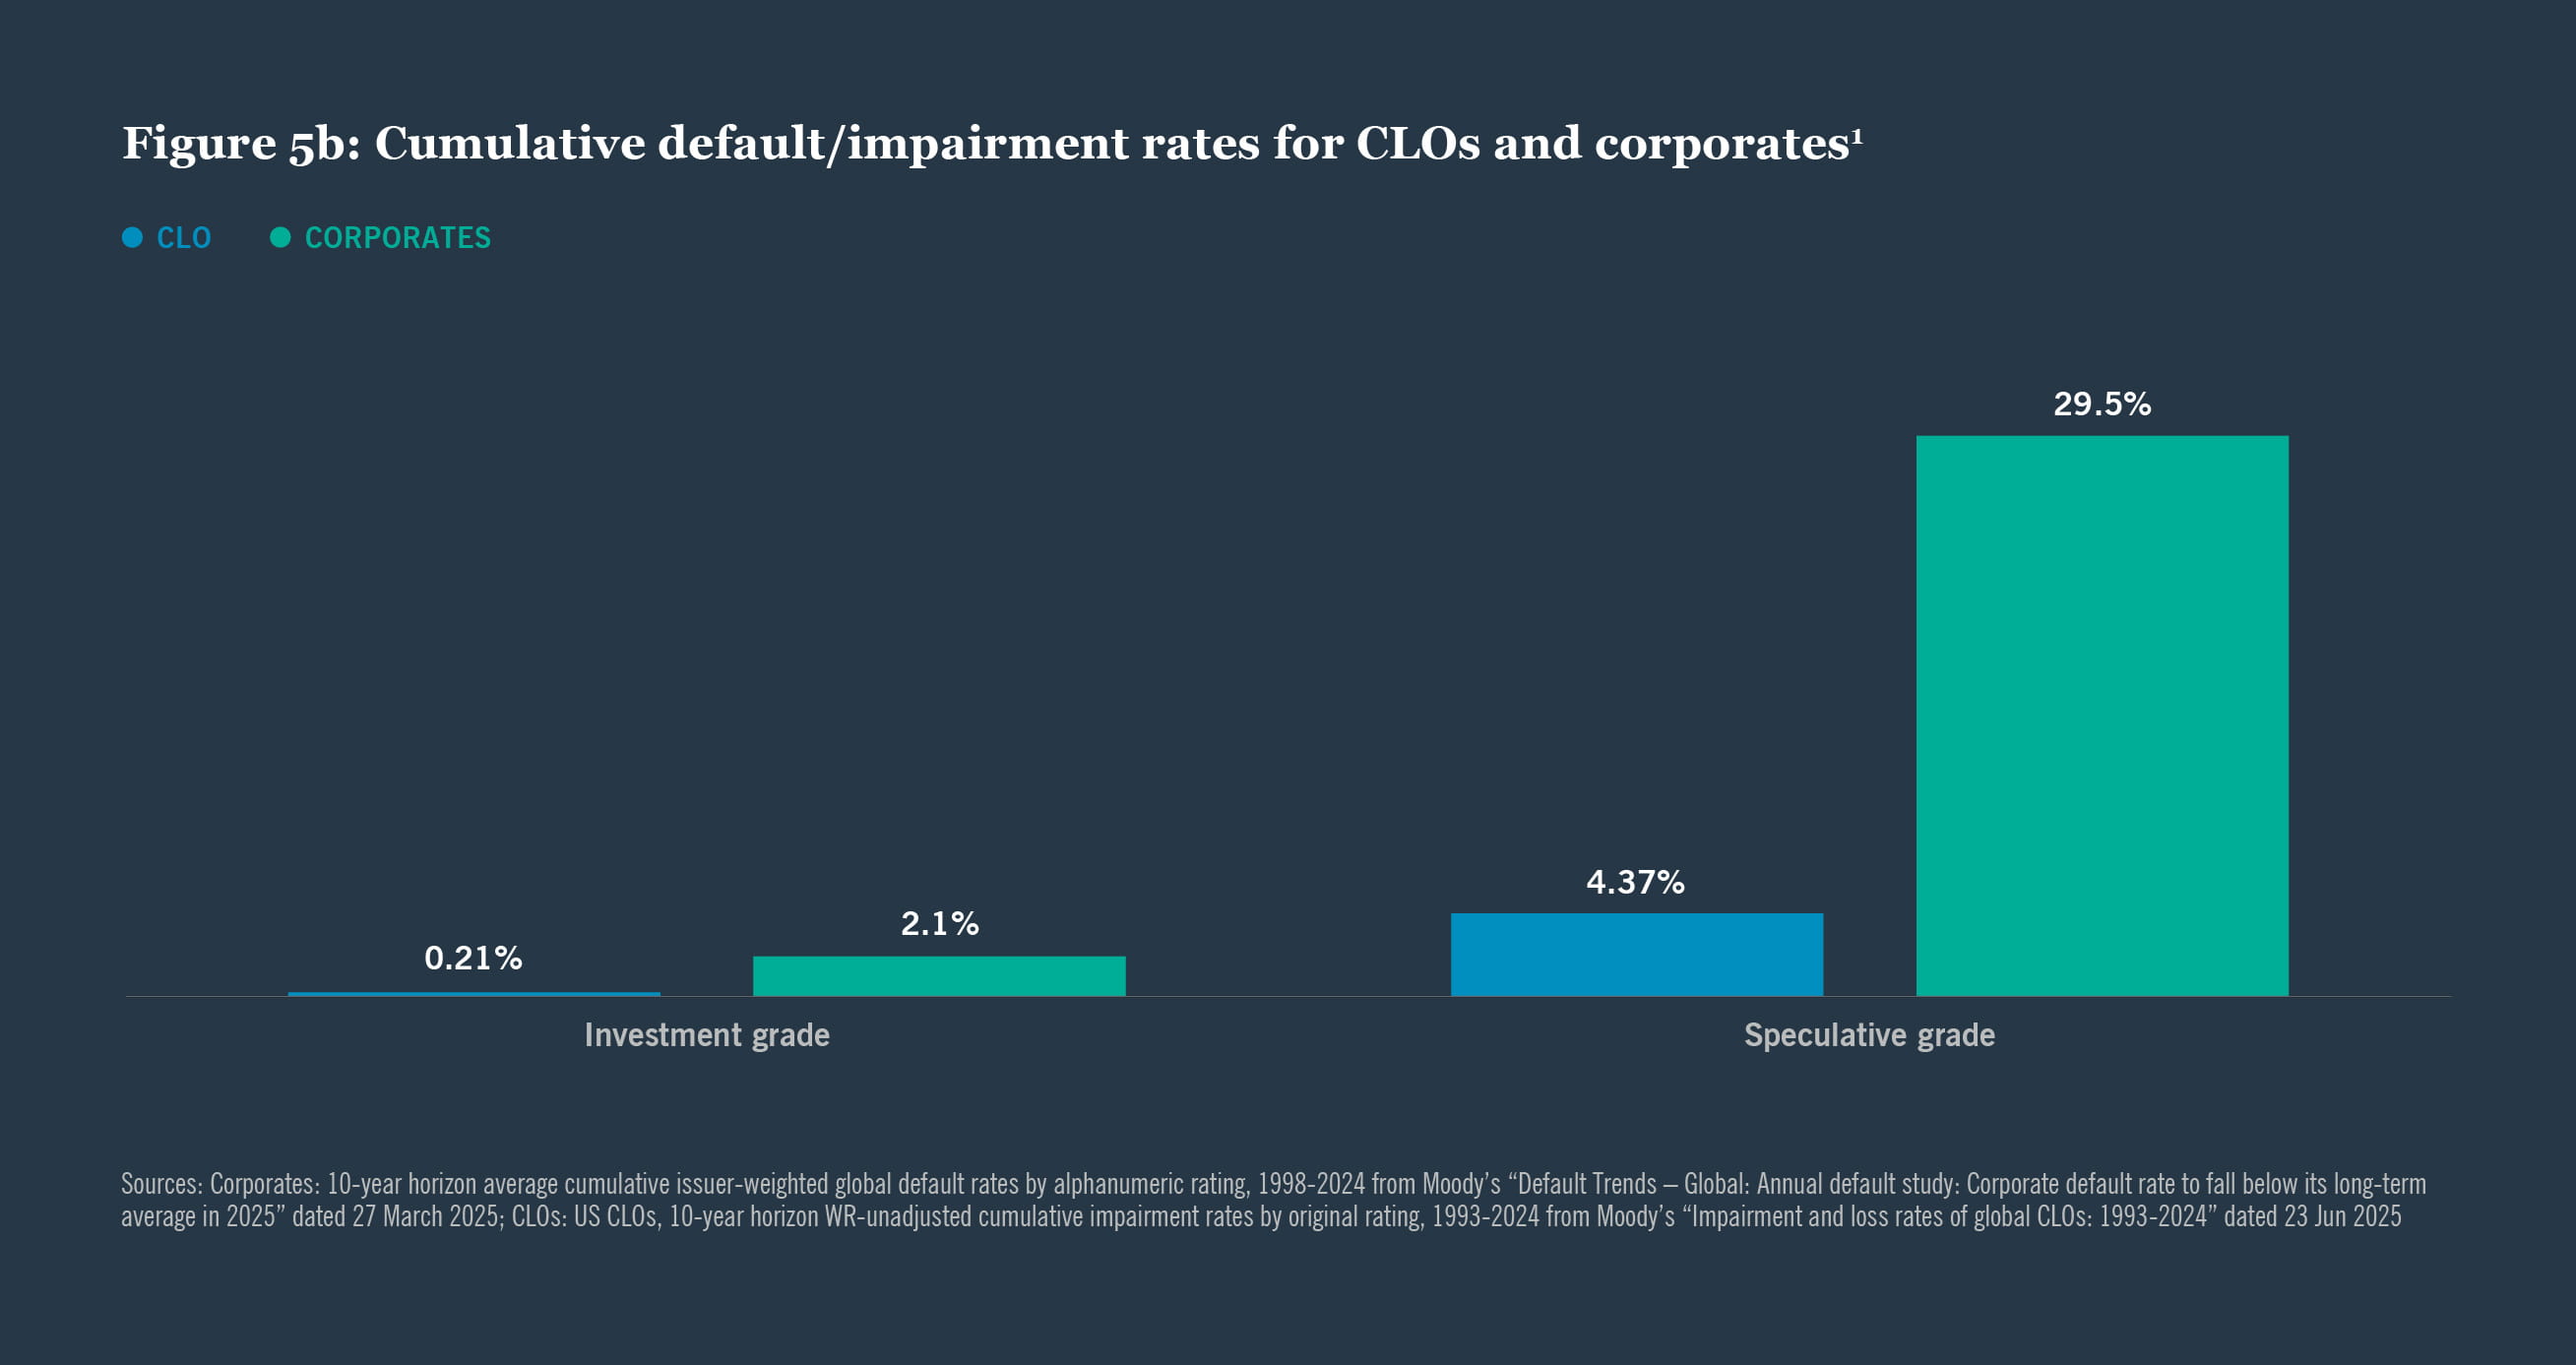
When examined on a long-term basis, since the GFC, CLO BB tranches have outperformed both leveraged loans and high yield bonds on a total return basis, not only because the wider starting spread more than compensates for the larger but historically temporary mark-to-market drawdowns, but also the relatively small impairment rate compared to corporate bonds.
CLO equity — New issue
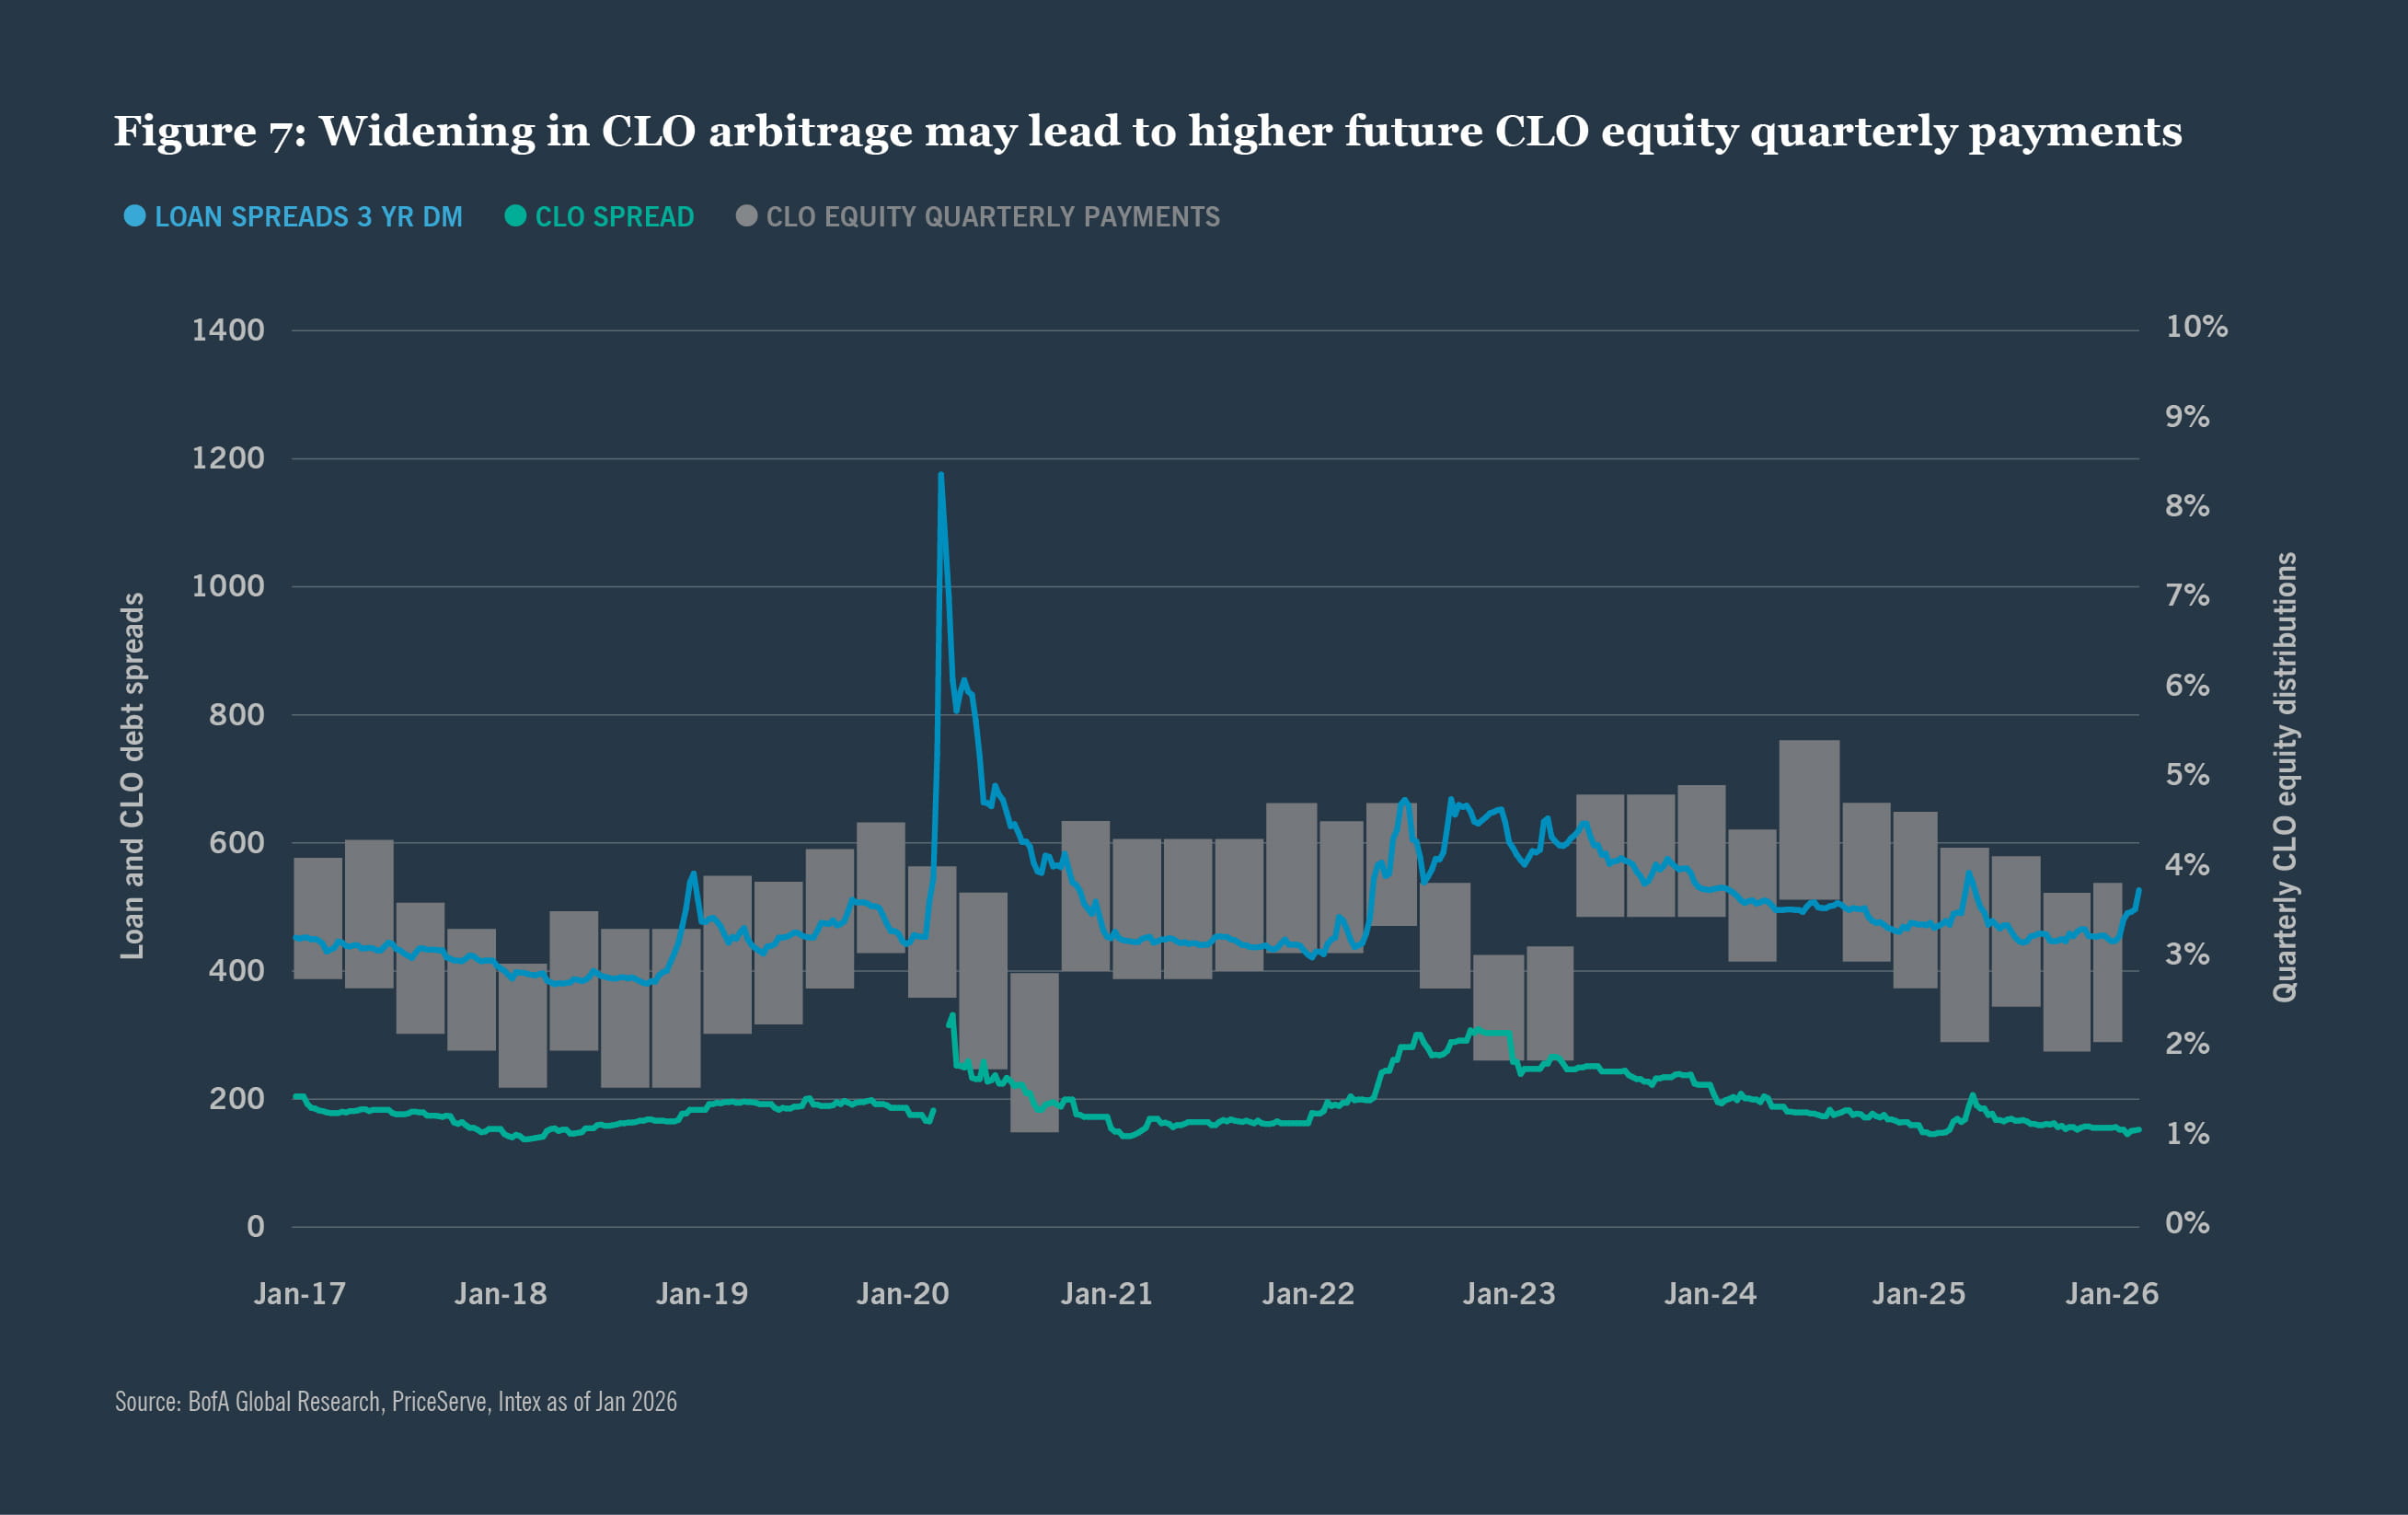
CLO equity returns are fundamentally driven by the arbitrage between what the underlying loan portfolio earns and what the CLO liabilities cost. The wider this arbitrage, the more cash flow flows through to equity on a quarterly basis. When loan prices decline, several things happen simultaneously that could improve new issue CLO equity returns, provided the equity investor and manager are positioned to take advantage.
When loans trade below par — for example at 97 or 98 cents on the dollar — a CLO manager building a new portfolio can acquire those loans at a discount, while the CLO's liability structure is sized based on the par value of the loans, not their market price.
The practical effect is significant. Creating an illustrative example with hypothetical values, if a manager creates a $400 million CLO portfolio by purchasing loans at an average price of 97 cents on the dollar, the actual cash outlay to acquire the portfolio is approximately $388 million, but the CLO's overcollateralization tests, and structural calculations treat the portfolio as having $400 million of par value. The $12 million difference represents immediate embedded value that flows to the equity tranche over time as those loans pay down or are sold at or above purchase price. See Figure 6.
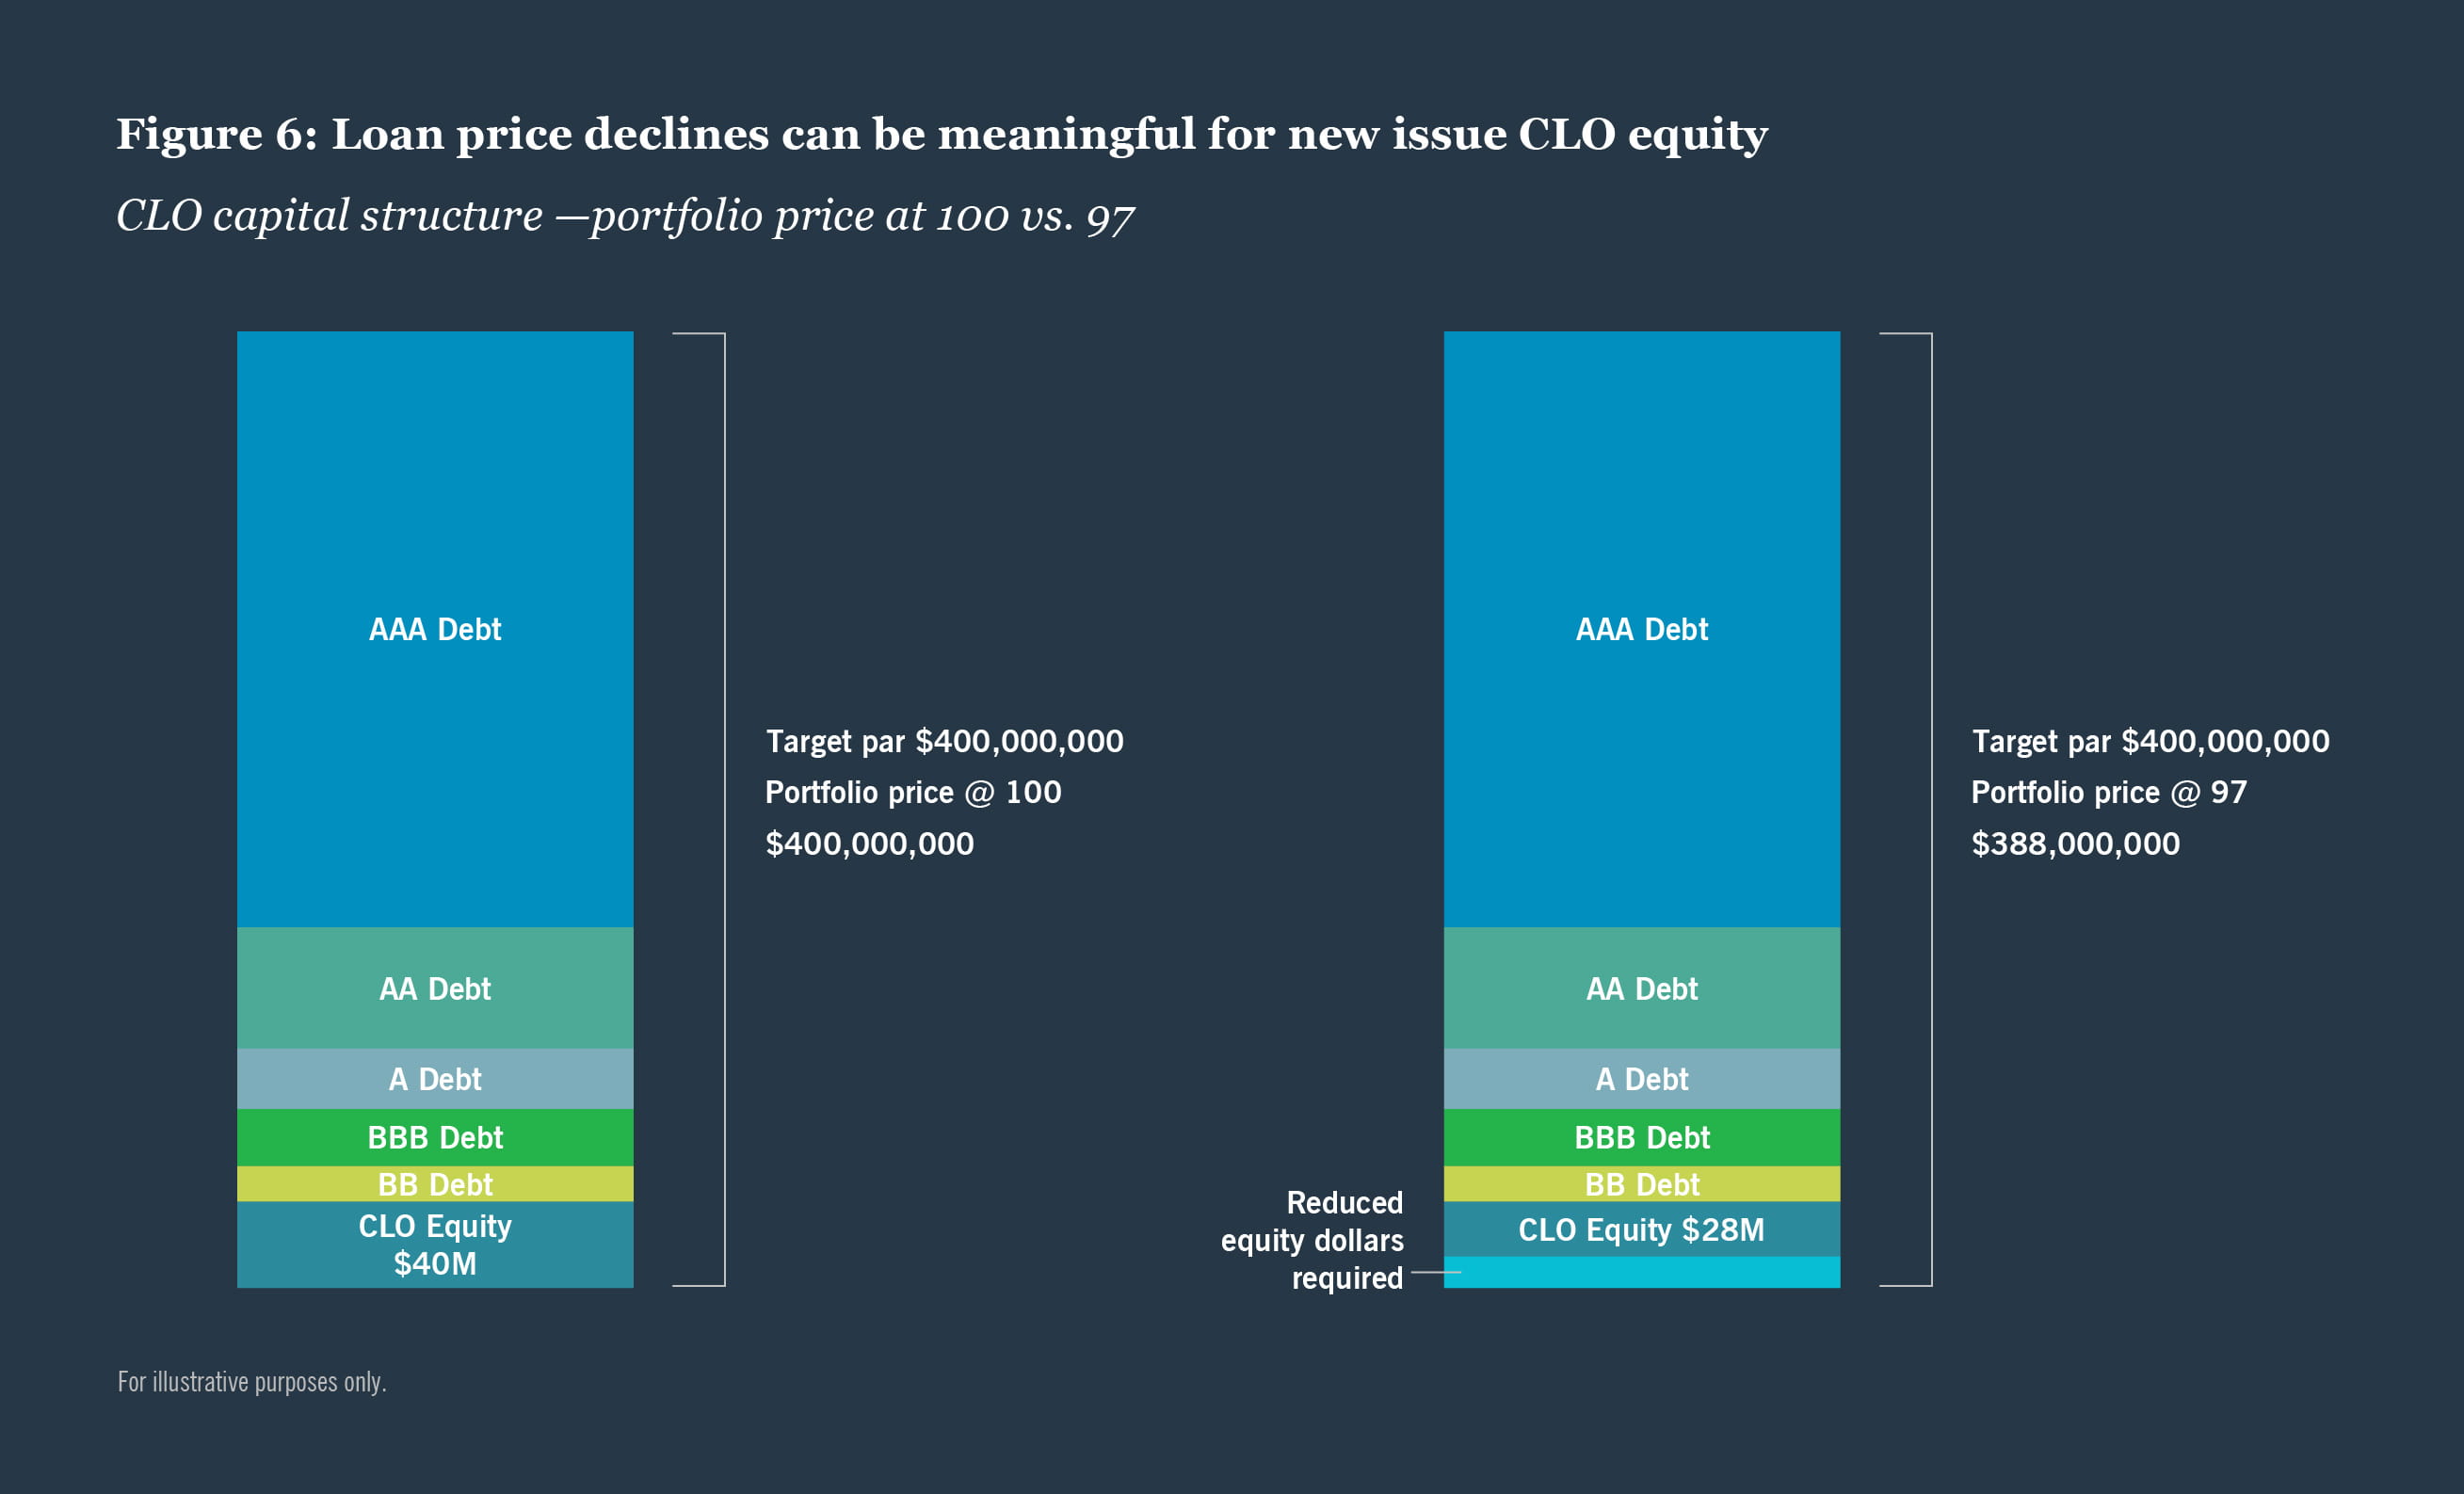
This discount purchase dynamic effectively means for the same asset pool to be purchased, less dollars will be required. This directly enhances equity returns. Utilizing the same CLO example as above, the loan portfolio will have an annual payment to the CLO equity between $5-6 million, with the $1 million range coming from the assumption of a higher cost of CLO debt. The cash distributions to the CLO portfolio created with a price of 100 and a lower cost of debt would be 15% ($6mm / $40mm CLO equity), compared to 18% for the portfolio with a price of 97 and a higher cost of debt ($5mm / $28mm CLO equity). As shown in Figure 7 below, in the past few weeks we have seen the CLO arbitrage begin to widen for the first time since Liberation Day 2025, which may cause future CLO equity quarterly payments to trend higher.
CLO equity — Secondary market
Buying CLO equity in the secondary market during periods of loan market weakness is a strategy employed by some of the most sophisticated structured credit investors, and the reasoning goes considerably deeper than simply buying at a discount. The opportunity arises from a convergence of technical, structural, and fundamental factors that can create a significant misalignment between the price at which secondary CLO equity trades and its intrinsic value during market dislocations.
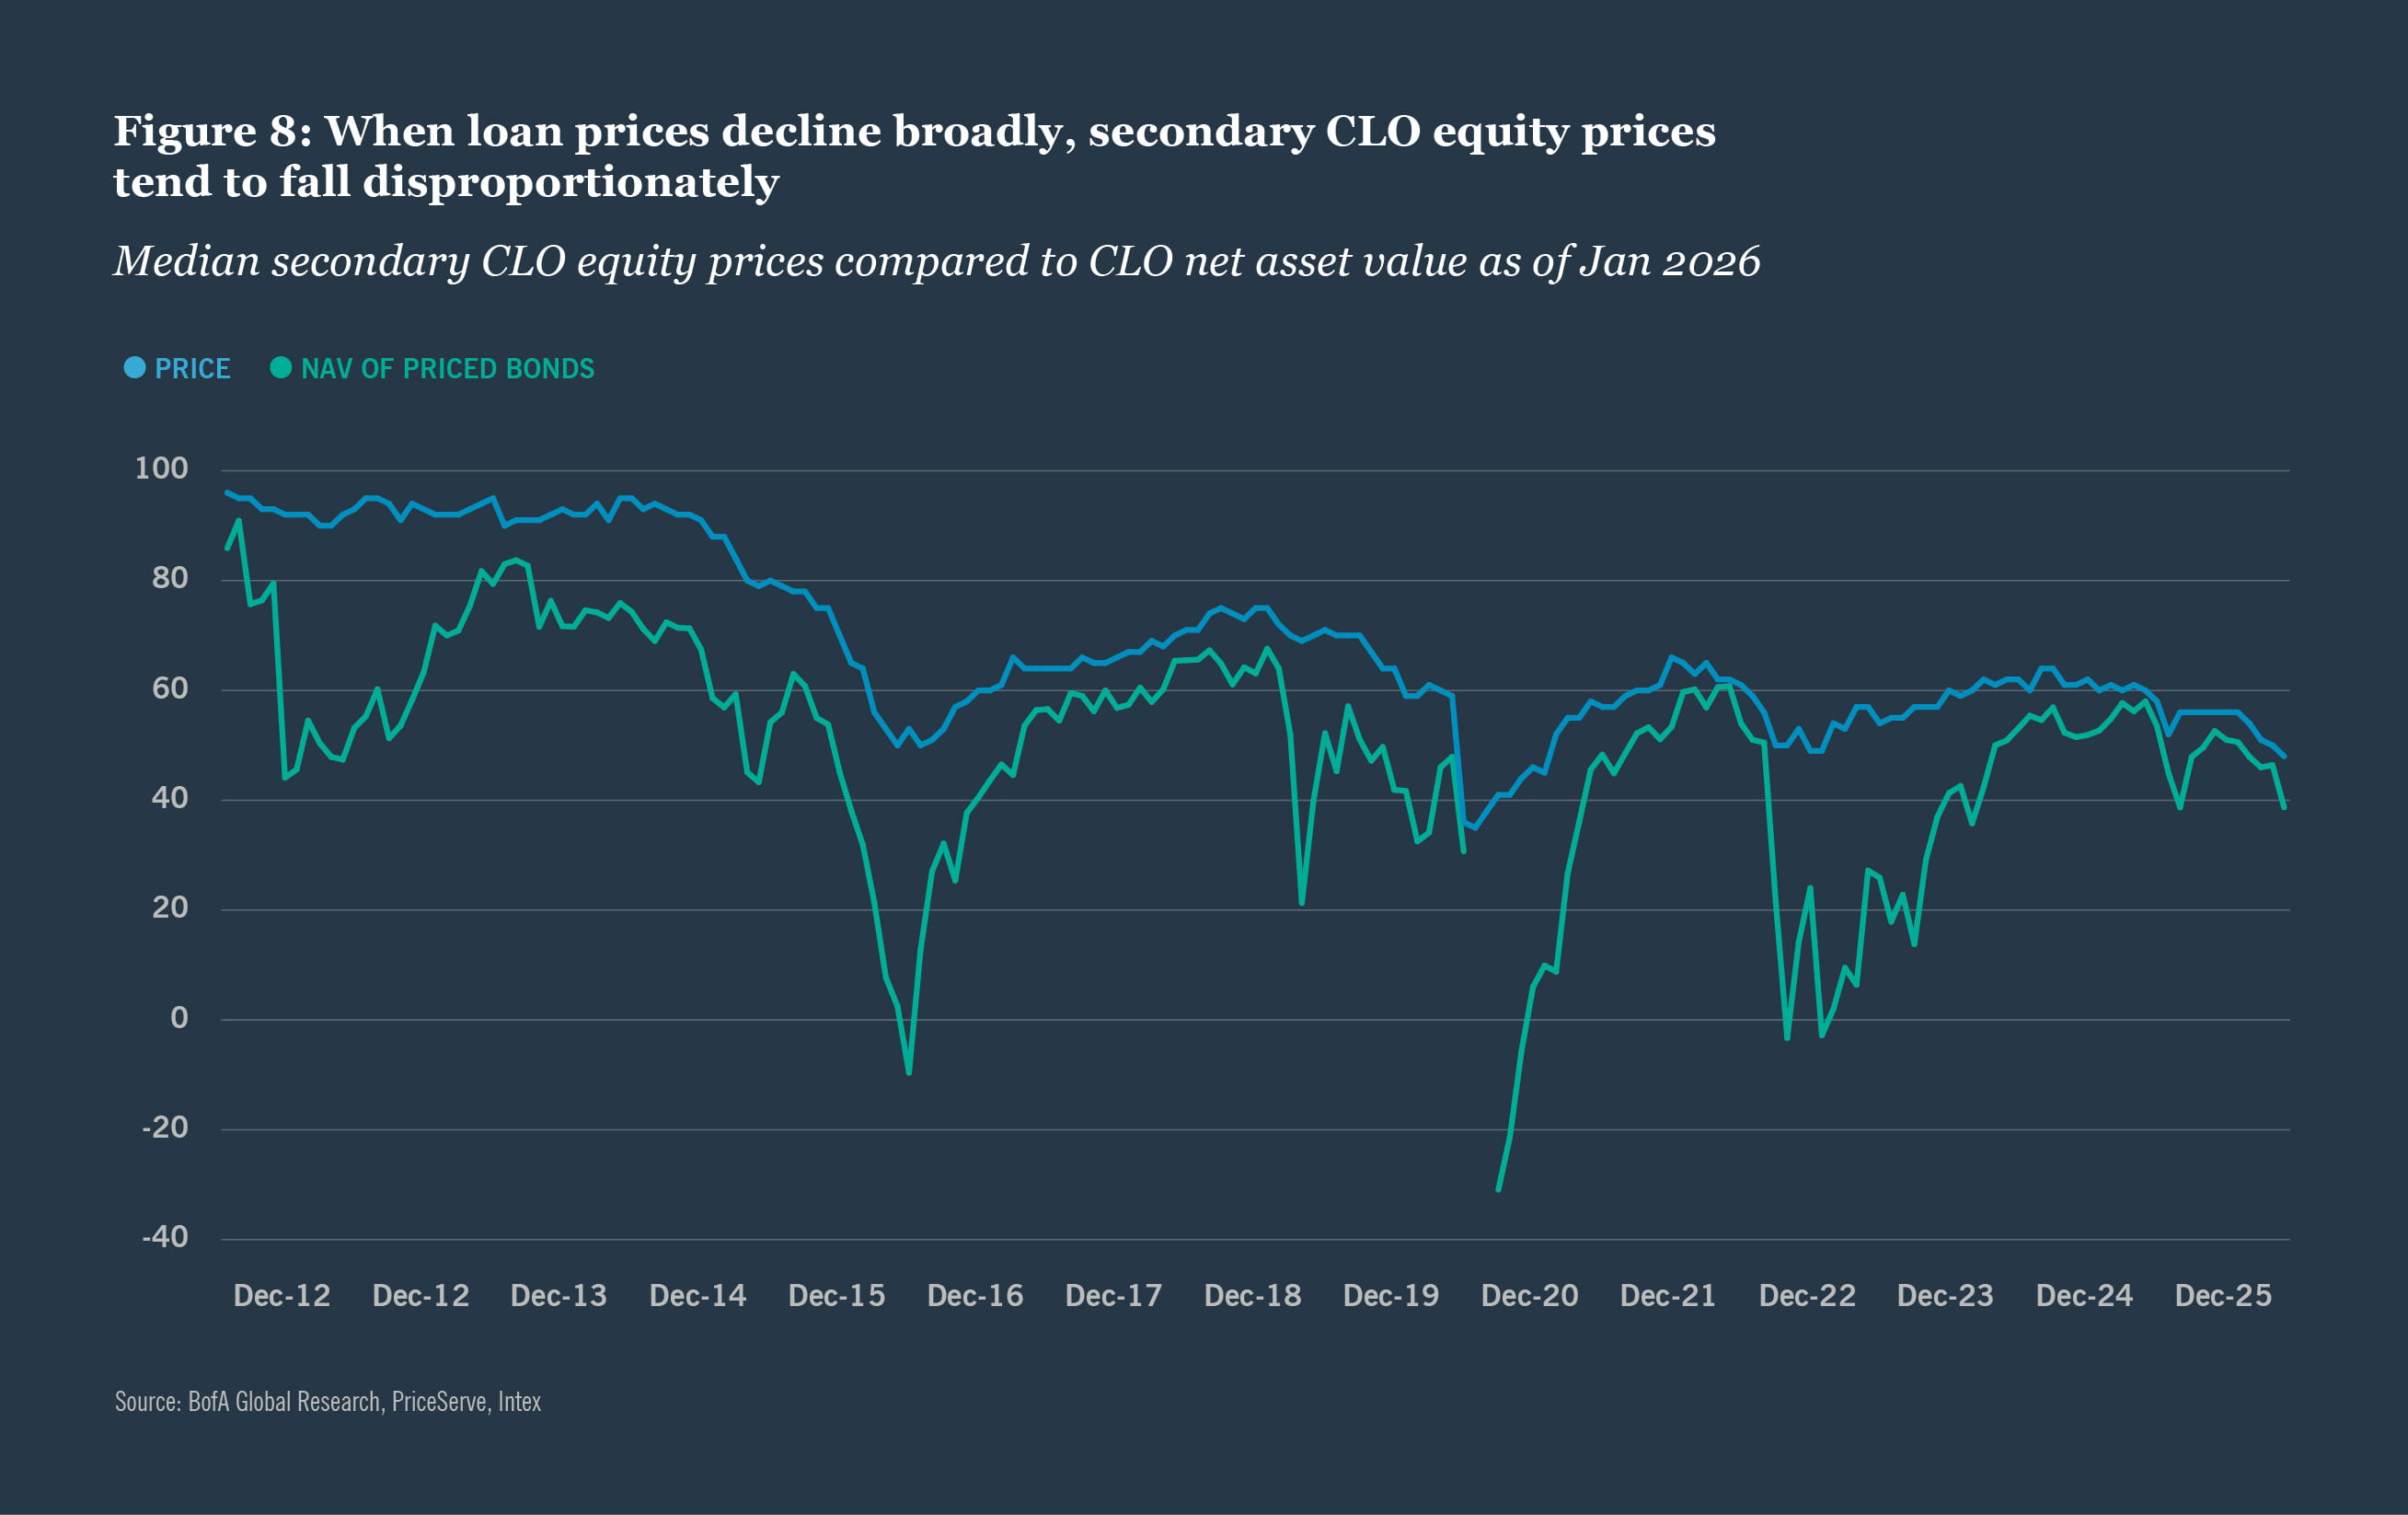
When loan prices decline broadly, secondary CLO equity prices tend to fall disproportionately relative to the actual fundamental impairment of the underlying portfolio. This overreaction occurs for several reasons.
Despite having a much more mature secondary market than 15 years ago, CLO equity is still an illiquid instrument with a very thin secondary market even in normal conditions. When risk sentiment deteriorates and loan prices fall, the universe of buyer demand for secondary CLO equity contracts sharply — often forced by redemptions, margin calls, risk limit breaches, or simply risk-off repositioning — while sellers remain present. This supply and demand imbalance has historically driven prices well below levels that are justified by discounted cash flow analysis of expected future distributions. The gap between market price and intrinsic value during these periods can be substantial.
Taking action during this volatility – options to invest
Gaining exposure to the CLO debt and equity market has become easier for investors with the growth of CLO public funds and captive equity funds. Now, investors have a variety of funds to choose from in various formats.
| CLO investment | Yield range | How to invest – Public options |
How to invest – Private options |
|---|---|---|---|
| Investment grade debt | 4.5% - 6.5% | ETF | Fund / SMA |
| Below investment grade debt | 8.0% - 10.0% | Interval fund, Closed-end fund | Fund / SMA |
| Equity | 11.0% - 15.0%+ | Closed-end fund | Third party fund / Captive fund / SMA |
Current loan market volatility — driven by AI-related sector repricing and geopolitical uncertainty in the Middle East — has created a more targeted set of potential entry points across CLO BB debt, new issue CLO equity, and secondary CLO equity. These structured products, while volatile in price, have historical resiliency based on previous results. And while past performance can never guarantee future results, we are focused on acting on this investment opportunity while maintaining a cautious view of the risks.


1As of March 25, 2026
This material is not intended to be a recommendation or investment advice, does not constitute a solicitation to buy, sell or hold a security or an investment strategy, and is not provided in a fiduciary capacity. The information provided does not take into account the specific objectives or circumstances of any particular investor, or suggest any specific course of action. Investment decisions should be made based on an investor’s objectives and circumstances and in consultation with his or her financial professionals. The views and opinions expressed are for informational and educational purposes only as of the date of production/writing and may change without notice at any time based on numerous factors, such as market or other conditions, legal and regulatory developments, additional risks and uncertainties and may not come to pass. This material may contain “forward looking” information that is not purely historical in nature. Such information may include, among other things, projections, forecasts, estimates of market returns, and proposed or expected portfolio composition. Any changes to assumptions that may have been made in preparing this material could have a material impact on the information presented herein by way of example. Past performance is no guarantee of future results.
All information has been obtained from sources believed to be reliable, but its accuracy is not guaranteed. There is no representation or warranty as to the current accuracy, reliability or completeness of, nor liability for, decisions based on such information and it should not be relied on as such.
For term definitions and index descriptions, please access the glossary on nuveen.com. Please note, it is not possible to invest directly in an index.
CFA® and Chartered Financial Analyst ® are registered trademarks owned by CFA Institute.
A word on risk
All investments carry a certain degree of risk, including loss of principal, and there is no assurance that an investment will provide positive performance over any period of time. Any investment in collateralized loan obligations or other structured vehicles involves significant risks not associated with more conventional investment alternatives, such as the risk that distributions from the collateral may not be adequate to make interest or other payments; the quality of the collateral may decline in value or default; the Fund may invest in tranches of CLOs that are subordinate to other tranches; and the CLO’s manager may perform poorly. The portfolios described herein are dynamic and may change over time. Use of the investment process tools and techniques described herein is no guarantee of investment success or positive performance.
The risk associated with Collateralized Loan Obligations (CLO) are loans and high yield securities, the risk that distributions from the collateral may not be adequate to make interest or other payments; the quality of the collateral may decline in value or default; the Fund may invest in tranches of CLOs that are subordinate to other tranches; and the CLO’s manager may perform poorly.
Investments in any of the above sectors are subject to the risks specific to those industries, including commodity price volatility, supply chain disruption, and broader macroeconomic deterioration. These risks may adversely affect the value of underlying loan portfolios and CLO collateral. Investing in CLO BB tranches involves significant risks, including mark-to-market volatility that can substantially exceed fundamental credit losses during periods of market stress. Historical patterns of recovery are not a guarantee of future outcomes, and buy-and-hold investors may not always be positioned or able to hold through periods of extended dislocation.
This information does not constitute investment research as defined under MiFID.
Nuveen Asset Management, LLC is a registered investment adviser and an affiliate of Nuveen, LLC

